5
incident states
3
alert metric targets
4
channels
1.0 Alerts & Incidents
Alert Rules
What you get
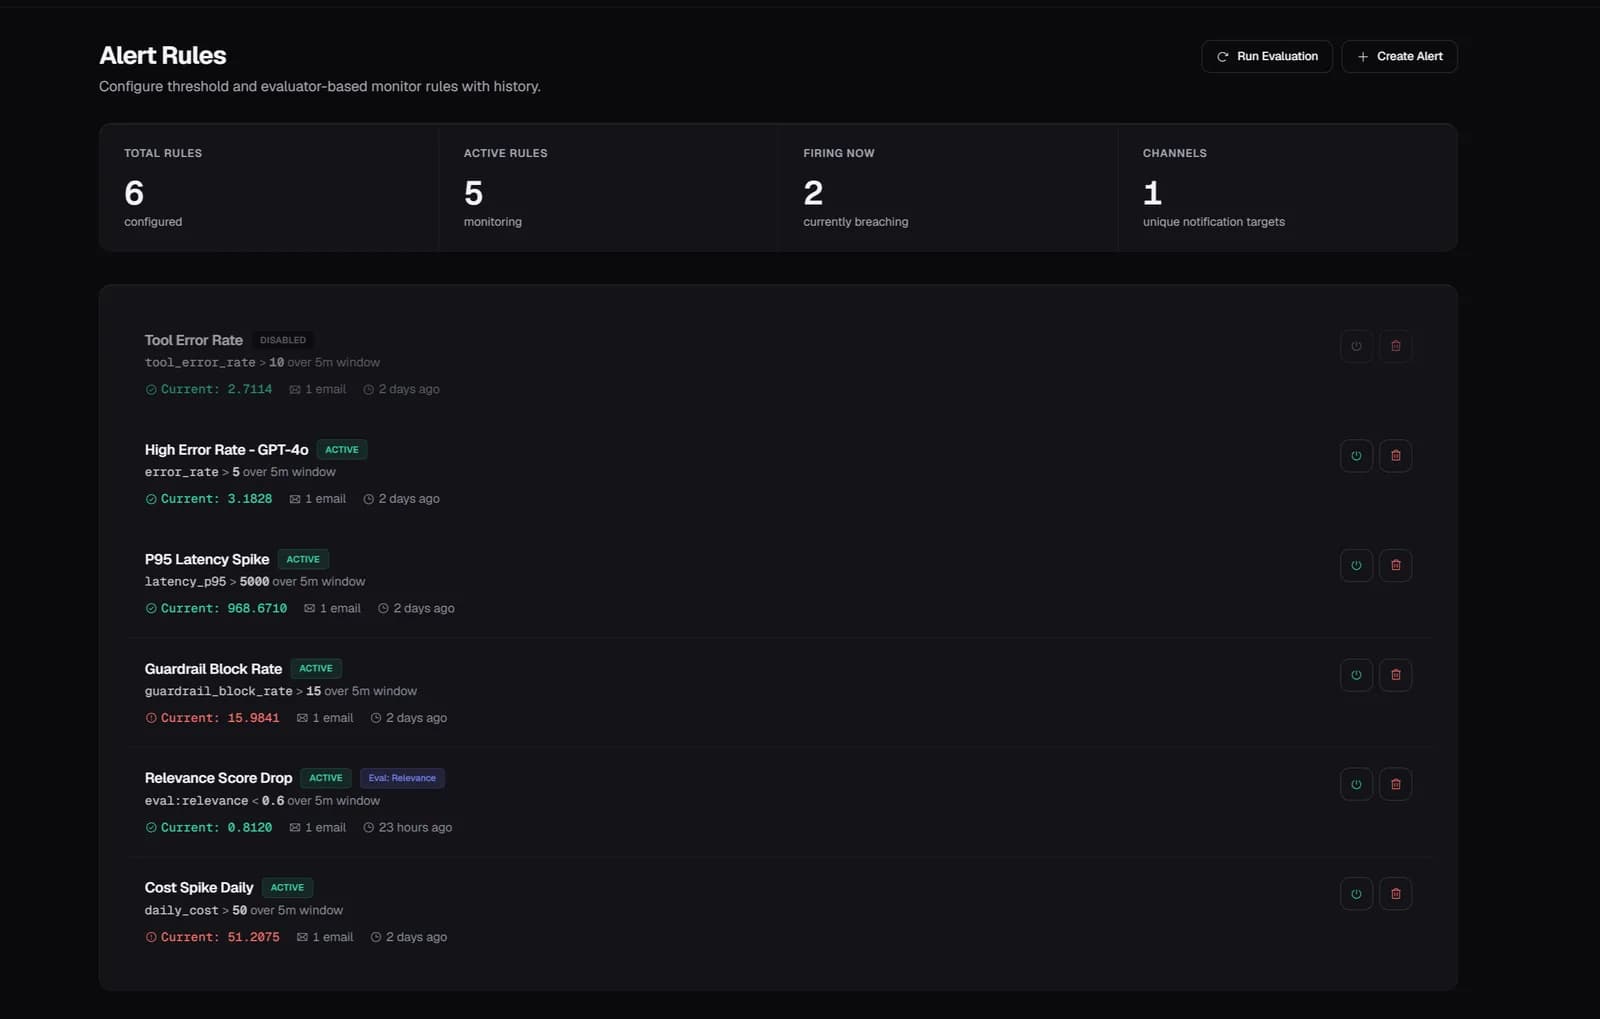
Alert rules fire when a metric crosses a threshold in a configurable window. Target error_rate, avg_latency, or total_cost. An optional comparison window enables week-over-week spike detection. Link alerts to evaluation metric keys — get paged when quality drops, not just when errors spike.
2.0 Alerts & Incidents
Multi-Channel Notifications
What you get
When an alert fires, notify via email (list of addresses), webhook (POST with payload), Slack, or PagerDuty. Mix channels per alert rule. Full alert history with sensitive fields (email addresses, webhook URLs) redacted.
3.0 Alerts & Incidents
Incident Lifecycle
What you get
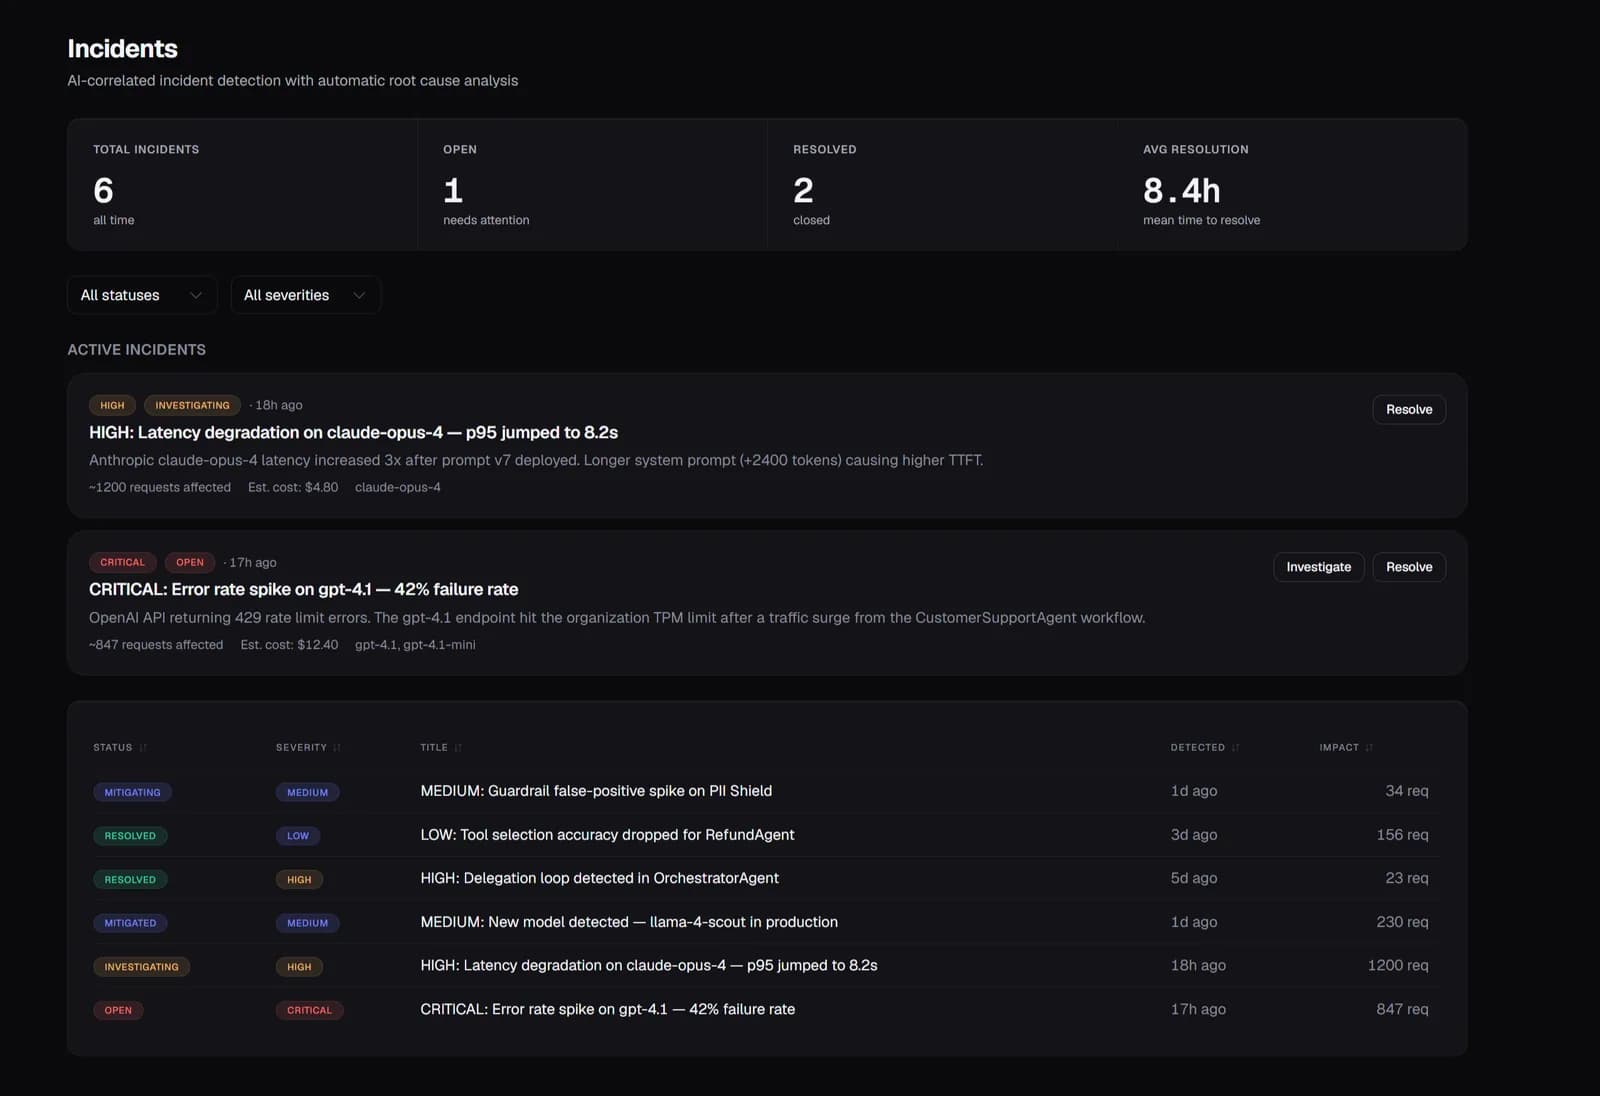
Incidents progress through a formal state machine: open → investigating → mitigating → mitigated → resolved. Severity levels (critical/high/medium/low) for triage. A background worker correlates related alerts and traces into incident candidates automatically.
4.0 Alerts & Incidents
AI Postmortem Generation
What you get
Every resolved incident can have a postmortem document. Zespan generates an AI-assisted draft from the incident timeline and related traces — what happened, when, which agents were involved, and how it was resolved. Editable and persistent at /incidents/[id]/postmortem.
Setup
Two lines of code.
Running in minutes.
No forking and no architecture changes. Traces appear within seconds of the first agent run, with cost attribution, eval scores, and anomaly alerts on by default.
Common questions
Can I alert on output quality — not just error rate?
Yes. Link an alert rule to any evaluation metric key — e.g., 'faithfulness'. When the average faithfulness score for a time window drops below your threshold, Zespan fires the alert exactly like an error_rate alert. This is the only LLM monitoring platform that supports eval-based alerting natively.
What's the minimum alert window I can configure?
The windowMin parameter accepts any positive integer (minutes). There's no enforced minimum — you can configure a 1-minute window for very short-cycle checks. In practice, 5–15 minutes balances sensitivity with noise reduction.
How is AI correlation different from manual incident creation?
Manual incidents require someone to notice a problem and create the incident. AI correlation runs a background worker continuously that clusters related alerts and trace anomalies into incident candidates automatically — so the incident exists before you've even looked at dashboards.
Can I integrate Zespan alerts with my existing on-call rotation?
Yes. PagerDuty integration dispatches to your existing services and schedules. Webhook integration lets you push to any system — Opsgenie, VictorOps, a custom Slack app, or your own incident management tooling.
Explore more features
All features →