Feature  ·  Agent Monitoring

Know which agents are healthy, and which aren't.

Composite health scores, delegation graphs, and per-agent cost attribution — built for systems with many cooperating AI agents.

Works with LangChain, CrewAI, AutoGen, Google ADK, and any framework using the SDK.

Start free →View docs
Zespan Agent Monitoring
Works withLangChainCrewAIAutoGenGoogle ADKLangGraphPydanticAIOpenTelemetry

A–F

health grades

0–100

composite score

3 signals

error · cost · eval

1.0  Agent Monitoring

Agent Registry — zero config

What you get

Auto-discovery: agent_name, agent_role, agent_framework detected from span attributesFull inventory: all agents active in a project with framework and call countsSupports LangChain, CrewAI, AutoGen, Google ADK, and custom agents

Every agent that touches the SDK appears in the Agent Registry on its first run. Name, role, and framework are detected from span attributes automatically — no registration step, no YAML config.

Zespan Agent Registry showing auto-discovered agents with framework and cost stats

2.0  Agent Monitoring

Composite Health Score

What you get

Error rate: last 24 hours — 40% weightCost trend: week-over-week change — 30% weightEval pass rate: last 7 days — 30% weight

Every agent gets a 0–100 score graded A–F, weighted across three signals. If an agent starts degrading — error rate creeping up, cost trending higher, eval scores slipping — the health score reflects it before users notice.
Zespan agent health dashboard with composite scores, grades, and signal breakdown

3.0  Agent Monitoring

Delegation Graph

What you get

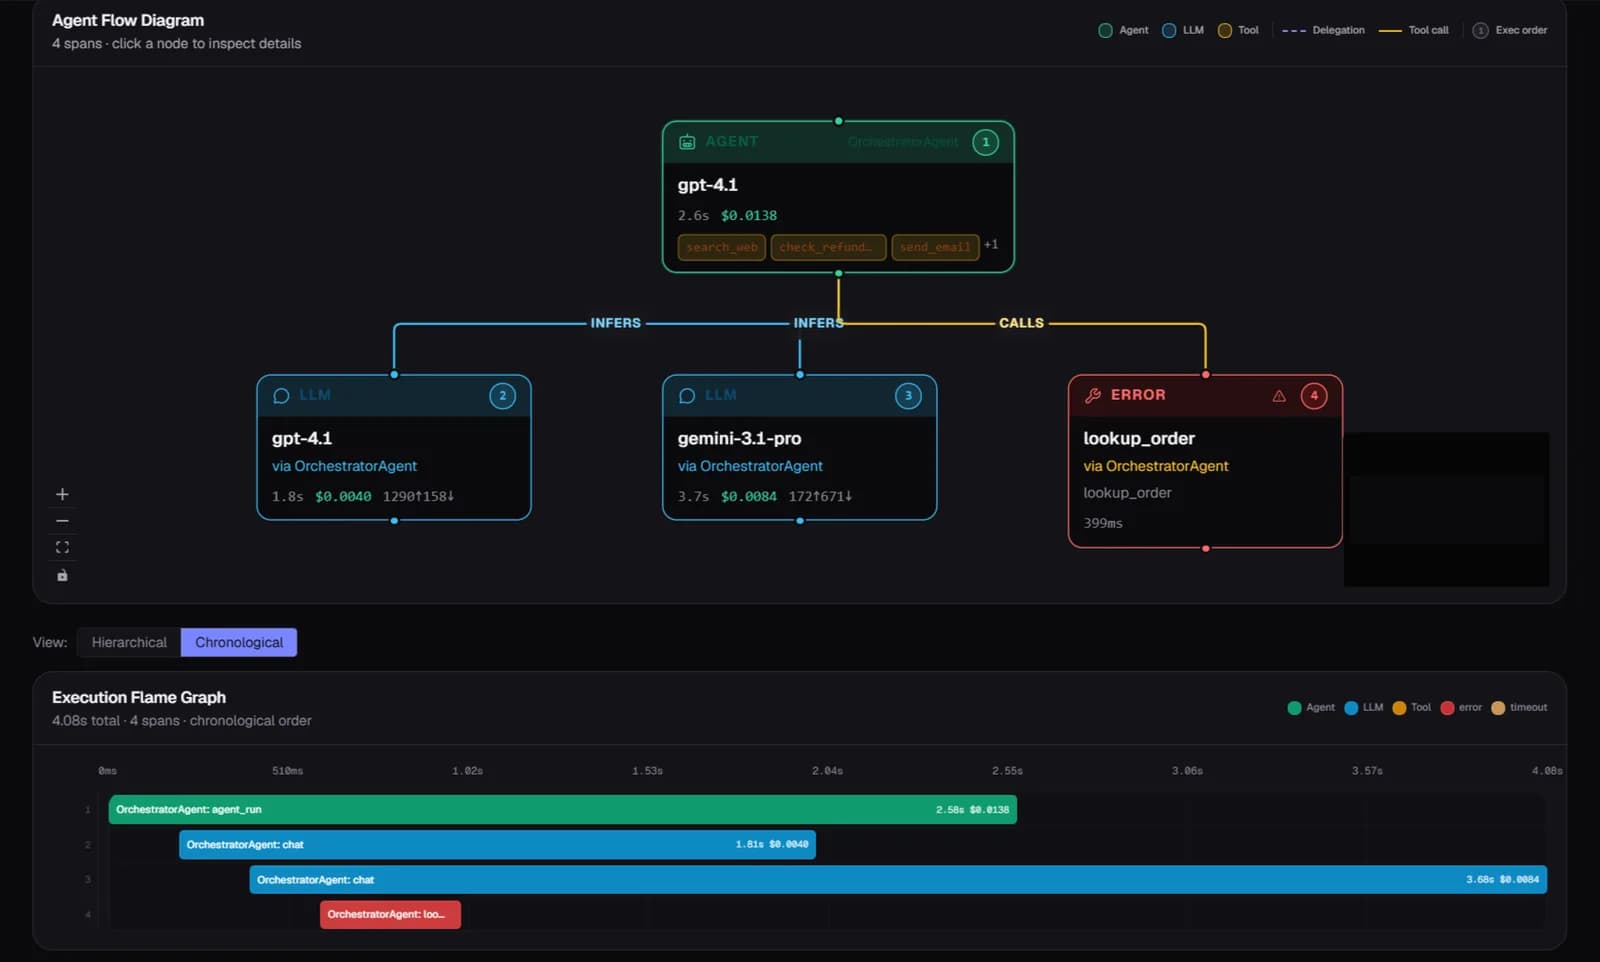
Per-hop attribution: cost, latency, and token counts per delegation edgeDerived from delegated_to / delegated_from span attributes automaticallyPlanning step sequences captured per agent for reasoning analysis

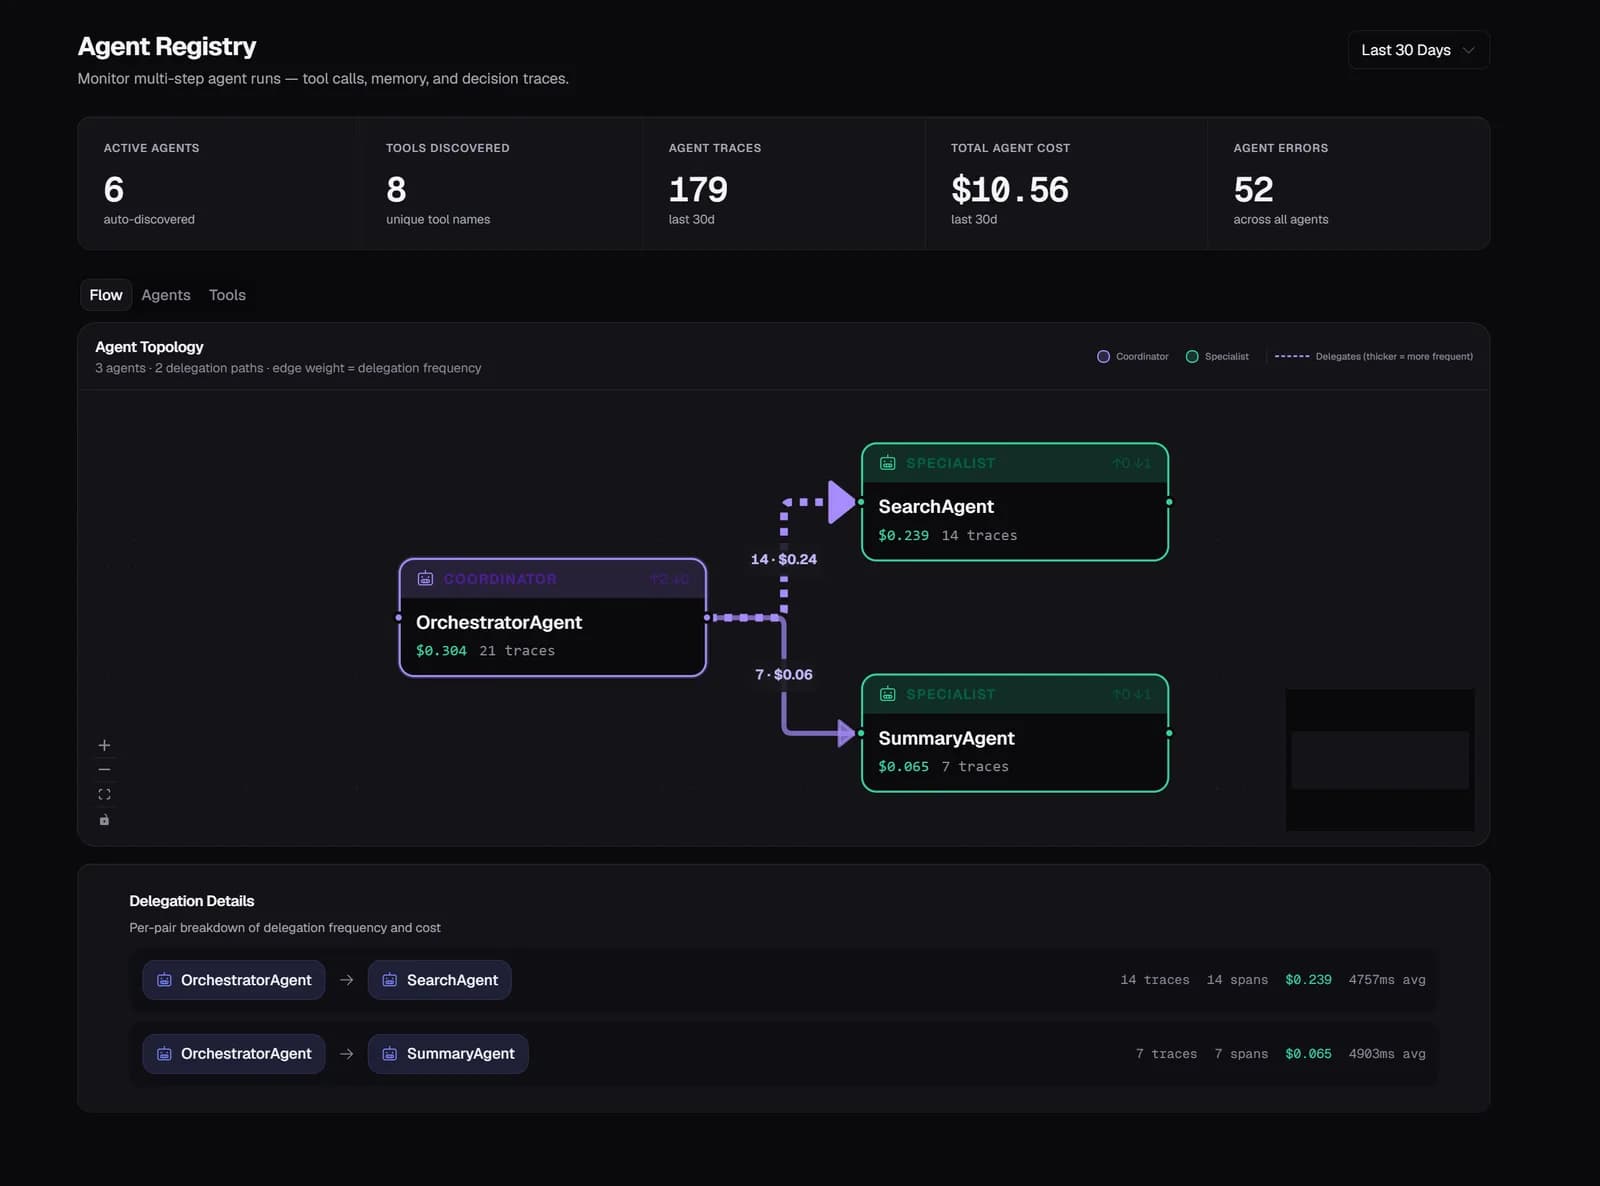
Visualizes which agents delegate to which other agents — cost and latency per handoff edge. Understand the coordination topology of your multi-agent system and pinpoint where time and money accumulate.

Zespan delegation graph showing multi-agent handoff chain with cost per hop

4.0  Agent Monitoring

Per-Agent Analytics

What you get

Tools per agent: which tools called, how often, at what success rateModels per agent: which models used across the time windowTime-series charts: all metrics over configurable time ranges

Drill into any agent to see its full metrics in time-series: LLM calls, tool calls, planning steps, delegations, guardrail checks, total cost, latency, token counts, and error count.

Setup

Under 5 minutes,
two lines of code.

No forking and no architecture changes. Traces appear within seconds of the first agent run, with cost attribution, eval scores, and anomaly alerts on by default.

typescript
import { Zespan, wrapOpenAI } from '@zespan/sdk';

const lt = new Zespan({ apiKey: process.env.ZESPAN_API_KEY });
const openai = wrapOpenAI(new OpenAI(), lt);

// Tag each agent's calls — registry is built automatically
const res = await openai.chat.completions.create({ model: 'gpt-4o', messages }, {
  metadata: { agent_name: 'researcher', agent_role: 'retrieval' },
});

Common questions

How does Zespan know which agent made a call?

You pass agent_name and agent_role in the metadata when calling the SDK wrapper. Zespan reads these from span attributes and groups all calls under that agent. For framework integrations like LangChain or CrewAI, the callback handler injects these automatically.

What frameworks does agent monitoring support?

LangChain, LangGraph, CrewAI, AutoGen, Google ADK, PydanticAI, LlamaIndex, and any custom agent using the SDK or OpenTelemetry. If your agent makes LLM calls through any of the supported providers, it's monitored.

How is the health score calculated?

It's a weighted composite of three signals: error rate over the last 24 hours (40%), cost trend week-over-week (30%), and eval pass rate over the last 7 days (30%). The score updates in real time as new traces arrive.

Can I set alerts based on agent health?

Yes. You can set alert rules on error_rate for a specific agent's spans, or link an alert to an evaluation metric key. When the score crosses your threshold, Zespan notifies you via email, Slack, PagerDuty, or webhook.

Explore more features

All features →
TracingSee exactly what your agents are doing.Every LLM call, agent step, and tool invocation captured as a structured trace — with cost, latency, and tokens per span.EvaluationsMeasure output quality on every trace, automatically.12 built-in LLM-as-judge templates run on every new trace with no setup. Track quality trends, catch regressions, and run manual eval campaigns.GuardrailsStop bad outputs before they reach users.7 guardrail types run inline on every LLM request — block, warn, redact, or log. PII, toxicity, topic drift, format, cost ceiling, and custom rules.Prompt ManagementShip prompt changes without breaking production.Version history, production promotion, automatic regression detection after every deploy, and AI-powered optimization suggestions.

Your agents are running.
Do you know what they’re doing?

Observe, evaluate, guard, and control every agent, live in minutes. No credit card required.

Free tier availableUnder 5 min setupNo credit card