ZespanPilotinsights and actions in one chat

The reliability platform for AI agents.

Monitor traces, run evaluations, test prompts, enforce guardrails, and understand costs across every agent workflow.

OpenTelemetry NativeMCP Ready5-Minute SetupFree Tier Available

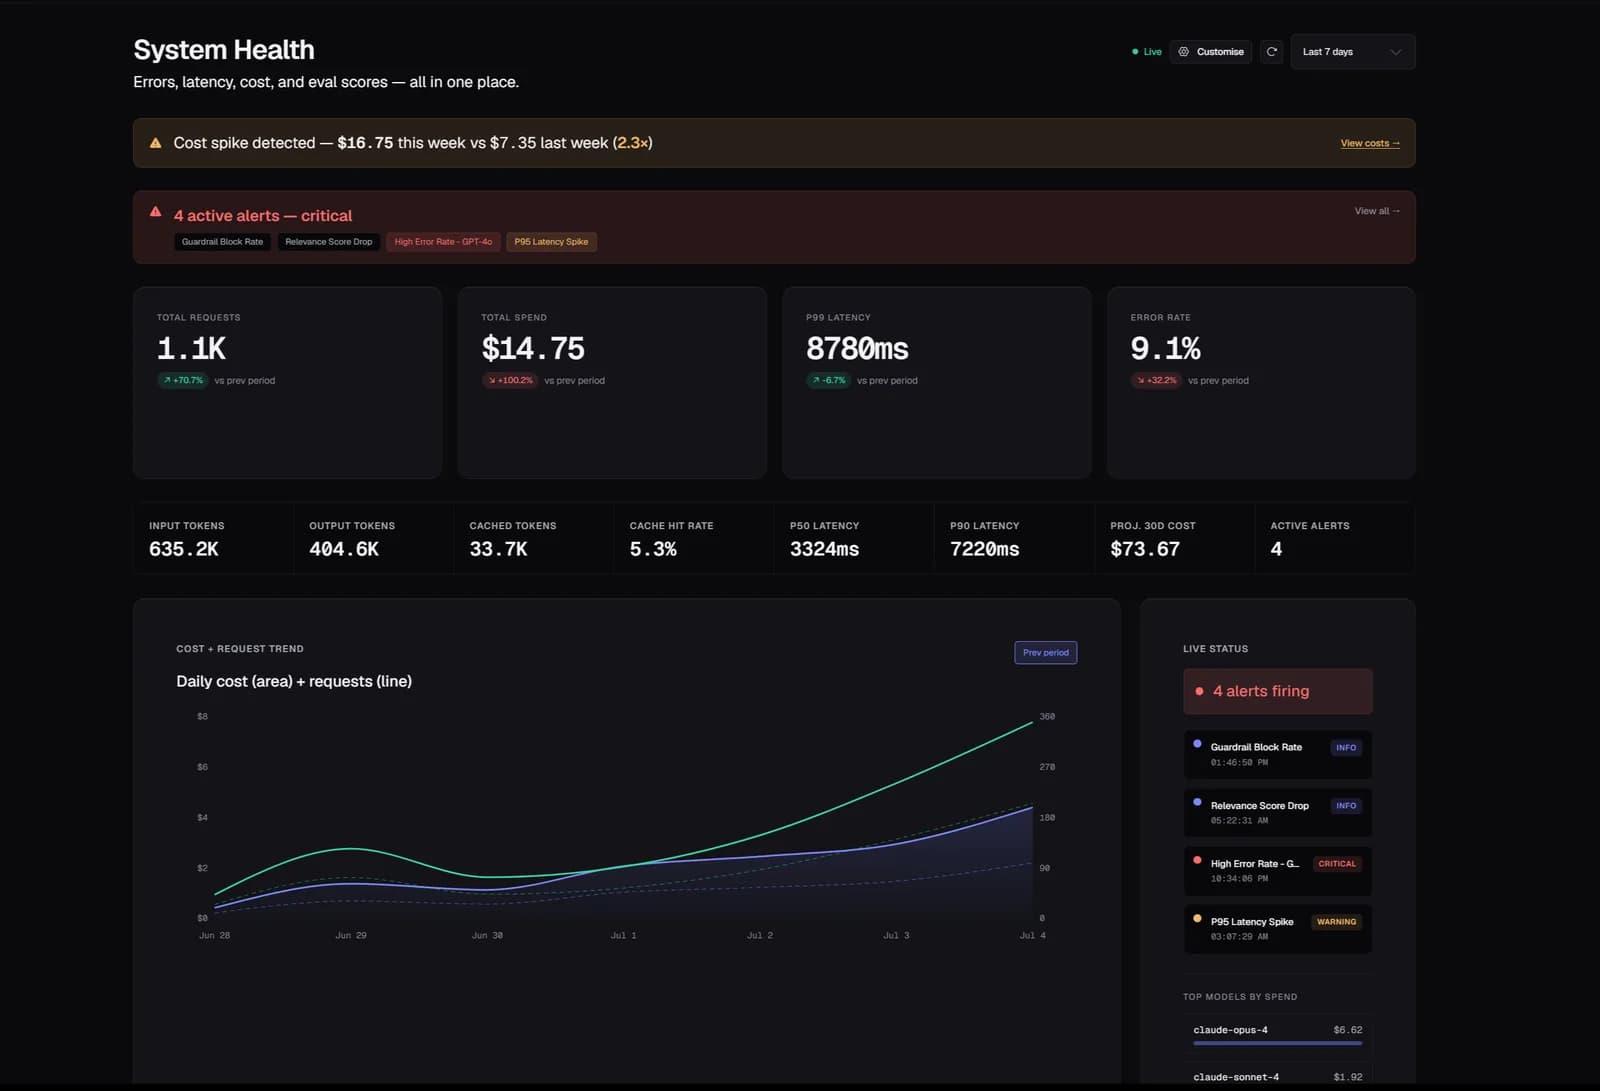
Zespan system health dashboard: total requests, spend, P99 latency, error rate, live alerts and daily cost trend
<5 min
From signup to first trace in production
2 lines
To instrument any agent or model
10+
AI providers & frameworks auto-detected
AgentOps
Per-agent cost, latency & error attribution built-in
OTel
Native OpenTelemetry, any backend

Instrument once. Works everywhere.

OpenAIOpenAI
AnthropicAnthropic
Google GenAIGoogle GenAI
AWS BedrockAWS Bedrock
OpenRouterOpenRouter
MistralMistral
GroqGroq
LiteLLMLiteLLM
LangChainLangChain
Google ADKGoogle ADK
CrewAICrewAI
AutoGenAutoGen
LlamaIndexLlamaIndex
Vercel AI SDKVercel AI SDK
HaystackHaystack
Semantic KernelSemantic Kernel

Your AI agent failed.

You have logs.

You have traces.

You still don't know why.

Zespan

Zespan connects every decision, tool call, prompt, memory lookup, and evaluation into a single timeline.

ZespanPilot

Not just observability.
An agent that acts.

Ask your agent stack anything in plain English — then tell ZespanPilot to fix it. Investigate, query, and take action across your whole project from one interface.

Role-based approval and a full audit trail mean it acts with guardrails — insight and action, without the risk.

  • Query your agent stack in plain English — no SQL
  • Take action across alerts, guardrails, evals, prompts, and cost
  • Run guided incident playbooks — with one-tap undo
  • Every action is role-gated, previewed, and audit-logged

Ask questions. Get answers. Take action.

Ask · Act · Automate

Answers are the start. Action is the point.

An open-ended query engine plus ~40 registered actions across 9 categories — every mutation gated by role and risk, dry-run previewed, and written to an audit log.

Read-only queries

Ask anything

Plain-English questions become live queries — cost by model, agent, or operation; error trends; latency percentiles; token and cache usage; eval scores; model comparisons.

TablesChartsSingle numbersDrilldownsRaw SQL
~40 actions · 9 categories

Act on it

Create alerts, toggle guardrails, run evals, roll back prompts, resolve incidents, set budgets, rotate keys, and push live SDK config — each gated by role and risk.

AlertsGuardrailsEvaluationsPromptsIncidentsCostSDK configProject & team
Guided playbooks

Automate the response

One command runs a multi-step playbook — cost-spike response, quality-regression fix, latency response, harden project, production-ready checklist — with one-tap undo.

Cost spikeQuality regressionLatencyHarden projectProduction-readyundo.last
Safe by default
Risk-tiered: low → criticalDry-run previewsConfirmation & team approvalEvery action audit-loggedPlan-gated & quota-aware
AlsoPage-context awareSilent model escalationSelf-tracingSession memory

01 · Observe & Debug

Find why any agent run failed.

Traces

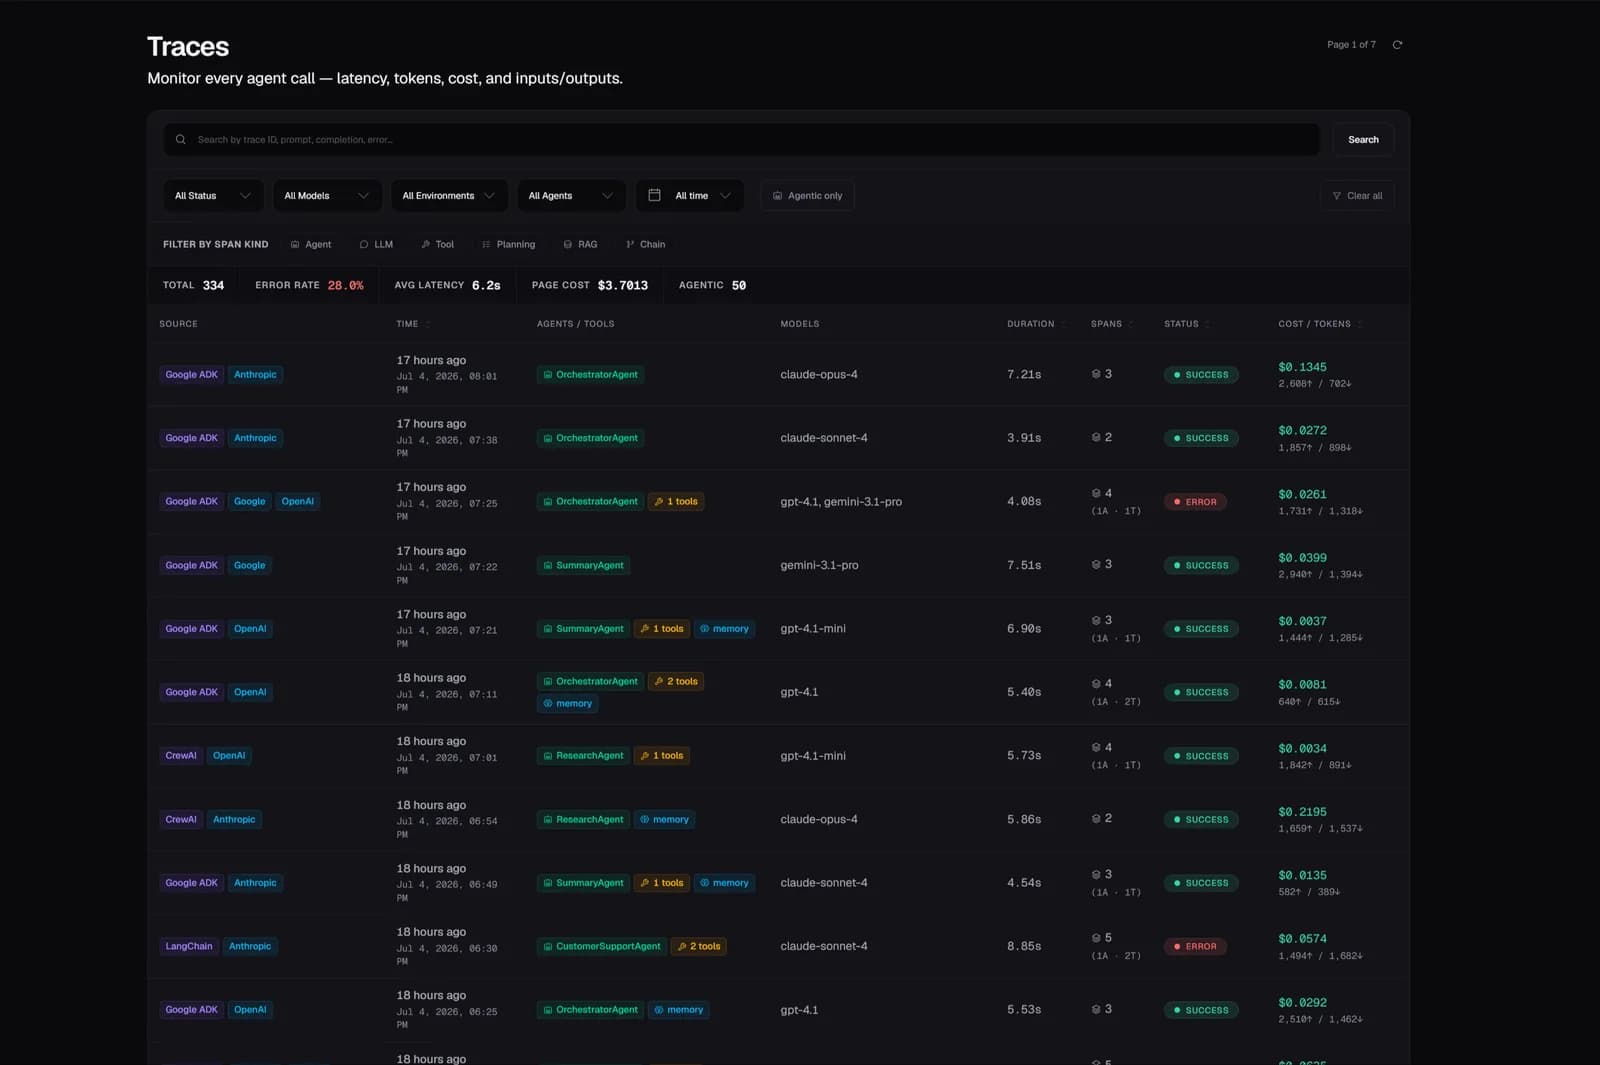
Every agent run is captured automatically the moment it happens — no sampling, no manual instrumentation. Search thousands of traces by status, model, agent, tool, environment, or time, and read spans, tokens, cost, and latency for each without opening a single row.

Zespan Traces
Trace detail

Open any run into a full span waterfall that lays out every LLM call, tool invocation, and memory lookup in order — each one timed and priced. A live inspector shows the exact input, output, tokens, and errors for whichever span you select, so the failing step is obvious in seconds.

Zespan Trace detail
Sessions

Related traces are grouped into user sessions so you can analyze whole conversations, not isolated calls. Replay any multi-turn interaction end to end, with cost, duration, and error count rolled up per session and full-text search across first messages.

Zespan Sessions
Agents

Zespan auto-discovers your delegation topology — which agent hands off to which — and renders it as a live graph. Coordinator and specialist roles are mapped for you, with per-hop cost and delegation frequency on every edge, so multi-agent behavior stops being a black box.

Zespan Agents
Tools

Track success rate, latency, cost, and failures across every tool call your agents make. A colour-coded health map surfaces the tools quietly breaking, and every tool is auto-discovered straight from your spans — nothing to register.

Zespan Tools
Models

See model-level usage, cost, and reliability across every provider in one place. Compare Claude, GPT, and Gemini side by side on p50/p90/p99 latency, spend, and error rate to know exactly where your budget and your failures are going.

Zespan Models

02 · Evaluate & Improve

Ship changes with confidence.

Evaluations

Score every trace automatically with LLM-as-judge and rule-based evaluators, so quality regressions surface before your users hit them. Use built-in evaluators or your own criteria, and watch pass rate and scores trend over time as you ship.

Zespan Evaluations
Prompts

Version, compare, and roll back prompts across deployments without touching code. Every version carries its own live cost and error rate, production labels track what's actually serving, and you can A/B test changes directly in production.

Zespan Prompts
Datasets

Promote real production traces into curated datasets in a single click — build regression sets from the failures that actually happened, not synthetic ones. Reuse them for evals and batch runs so fixed bugs stay fixed.

Zespan Datasets
Simulations

Replay agent scenarios against new prompts or models before you ship, so you know the pass rate before production finds out. Batch-run scenarios with assertions and compare runs side by side to catch regressions early.

Zespan Simulations

03 · Protect & Control

Guard behavior, control spend.

Guardrails

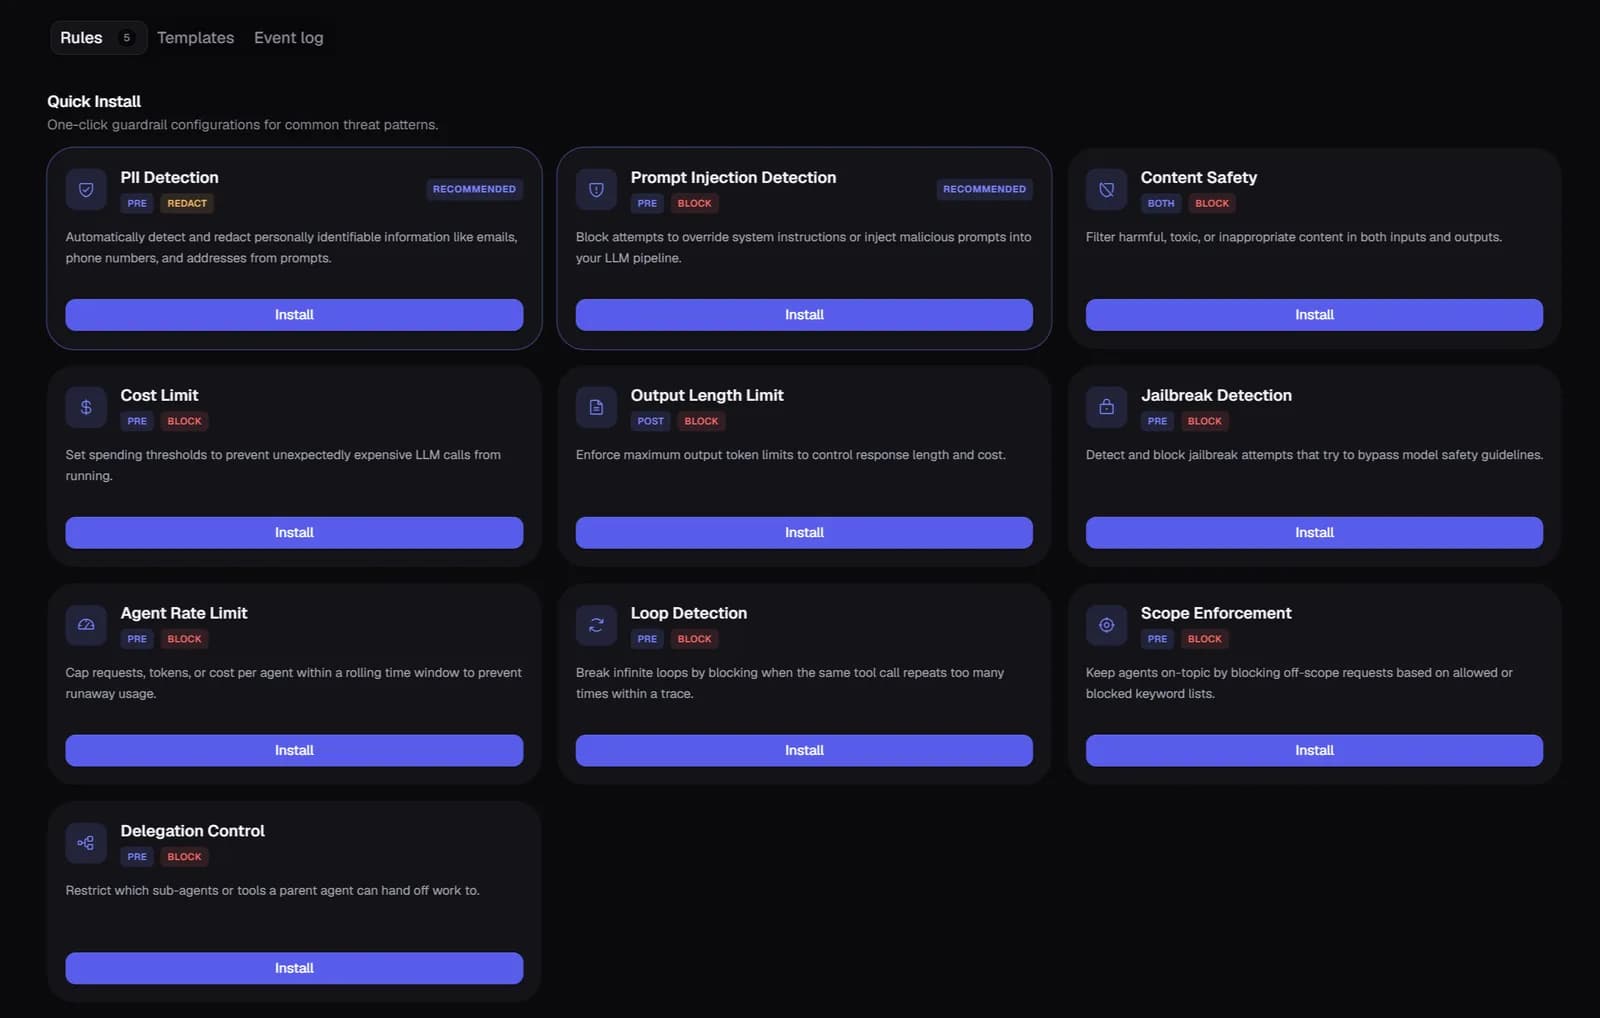
One-click protections run before and after every request to block PII leaks, prompt injection, jailbreaks, runaway loops, and out-of-budget calls. Nine quick-install threat patterns cover the common cases, each configurable to block or redact at the PRE or POST stage.

Zespan Guardrails
Cost Explorer

Track spend per model, per day, and per token type, with input, output, and cached tokens broken out. Built-in anomaly detection flags cost drift and spikes the moment they happen — not when the invoice arrives.

Zespan Cost Explorer
Attribution

Get exact cost attributed to every agent, tool, model, and user, with no manual tagging and no spreadsheet reconciliation. Break spend down along any dimension and see per-call cost and error rate for each.

Zespan Attribution
Forecast

Project cost and latency forward with confidence bands built from your recent telemetry. Upper-bound budget alerts warn you before you overspend — not after — so surprises stay off the invoice.

Zespan Forecast
Performance

Monitor latency, throughput, and reliability across every trace, with p50/p90/p99 broken out by model and by span kind over time. Timeout and rate-limit rates are tracked alongside, so slowdowns surface before users complain.

Zespan Performance
Alerts

Set threshold and evaluator-based alerts on the metrics that matter — latency, cost, error rate, and eval scores — and route them to email or PagerDuty the moment they fire. Every rule keeps a full firing history so you can see what has been noisy.

Zespan Alerts
Incidents

Error spikes, model changes, and prompt deploys are correlated into single incidents automatically, each with an AI-written root cause instead of just a red graph. Severity, affected requests, and mean-time-to-resolve are tracked so you know what to fix first.

Zespan Incidents

Why Zespan

Built for agents.
Not just models.

Most AI observability tools were built to monitor LLM calls. Zespan was built for the world where agents plan, delegate, use tools, and make autonomous decisions.

LLM Monitoring
Zespan
Tracks prompts and completions
Tracks complete agent workflows
Shows token usage
Explains why decisions were made
Monitors model latency
Monitors reasoning, tools, memory, and handoffs
Detects failures
Prevents failures with guardrails
Evaluates outputs
Evaluates entire agent systems

The shift from LLM monitoring to agent reliability is happening now. Start free →