Feature — Tracing
See exactly what your agents are doing.
Every LLM call, agent step, and tool invocation captured as a structured trace — with cost, latency, and tokens per span.
Works with OpenAI, Anthropic, LangChain, CrewAI, AutoGen, LlamaIndex, and OpenTelemetry.
< 5 min
setup
OTel native
OTLP/HTTP
100 events
per batch
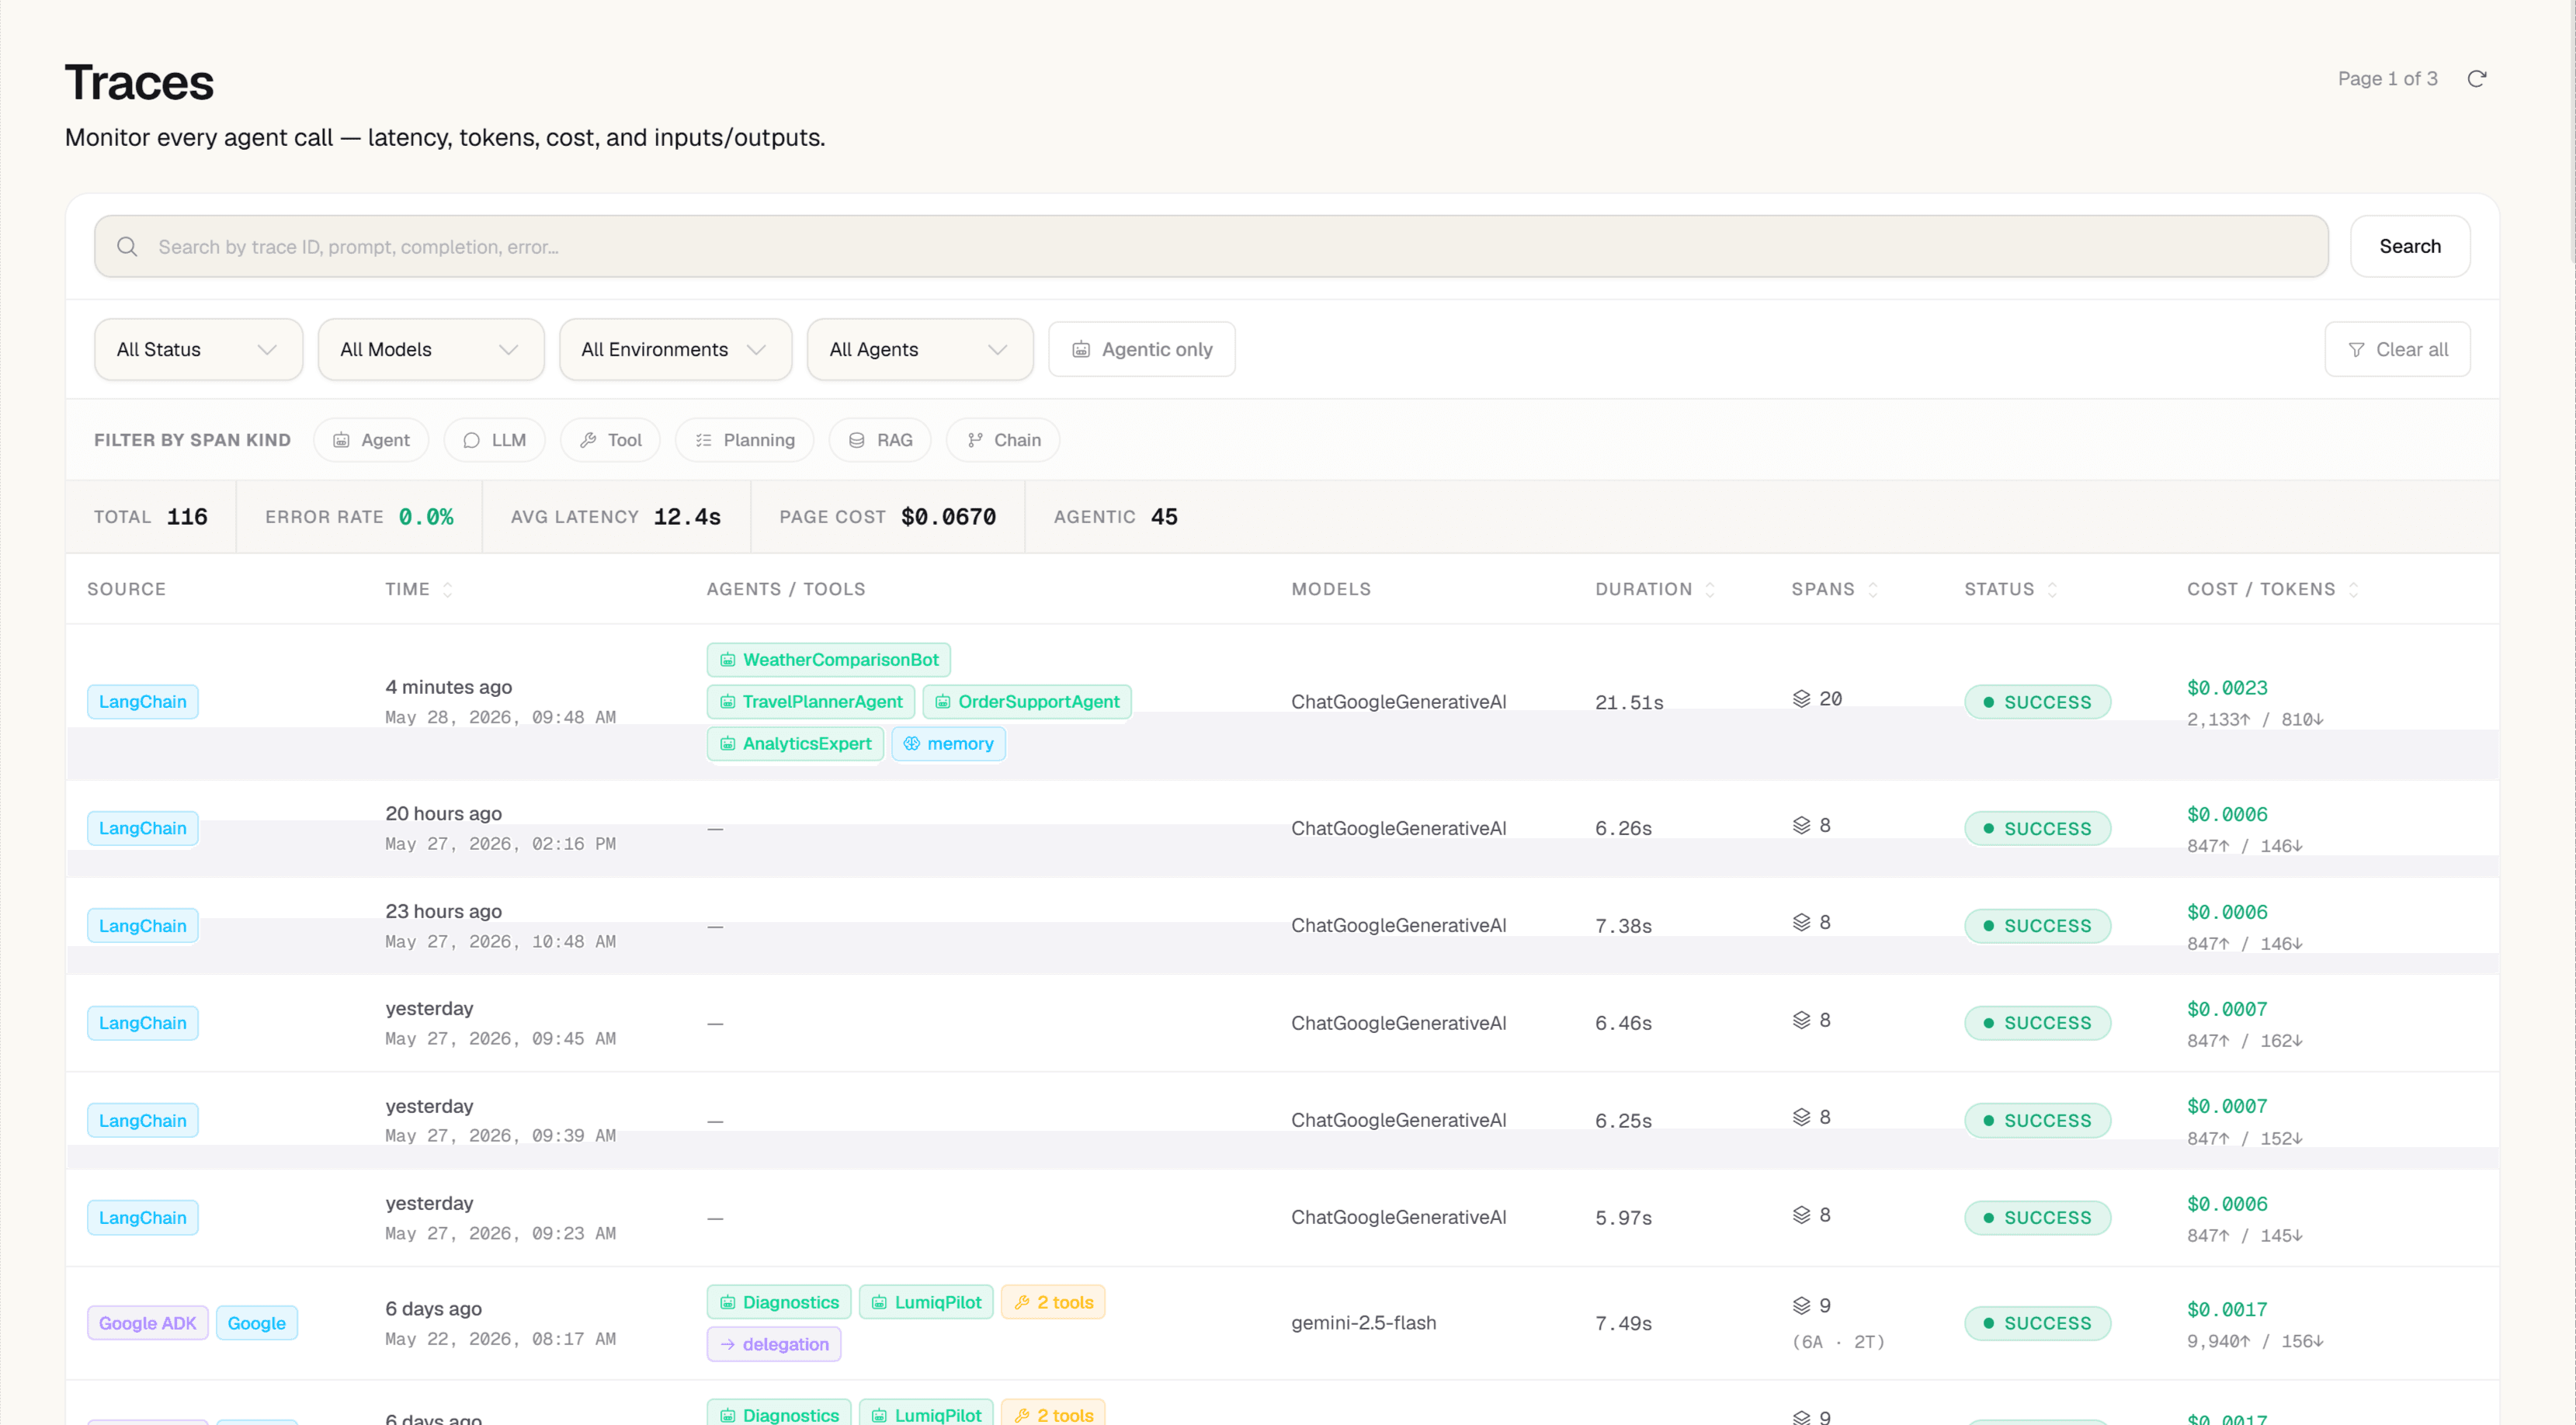
Trace Explorer
A filterable, sortable list of every trace — latency, cost, status, model, agent, and operation in one view. Click any trace to open the span waterfall: the full parent/child hierarchy with exact timing, tokens, and cost per span.
- Filter by status, model, agent, operation, user, environment, or time range
- Span attributes: model, provider, agent_name, tools_used, user_id, session_id, prompt_hash
- Error drill-down: filter by status=error, inspect error_code and message per span
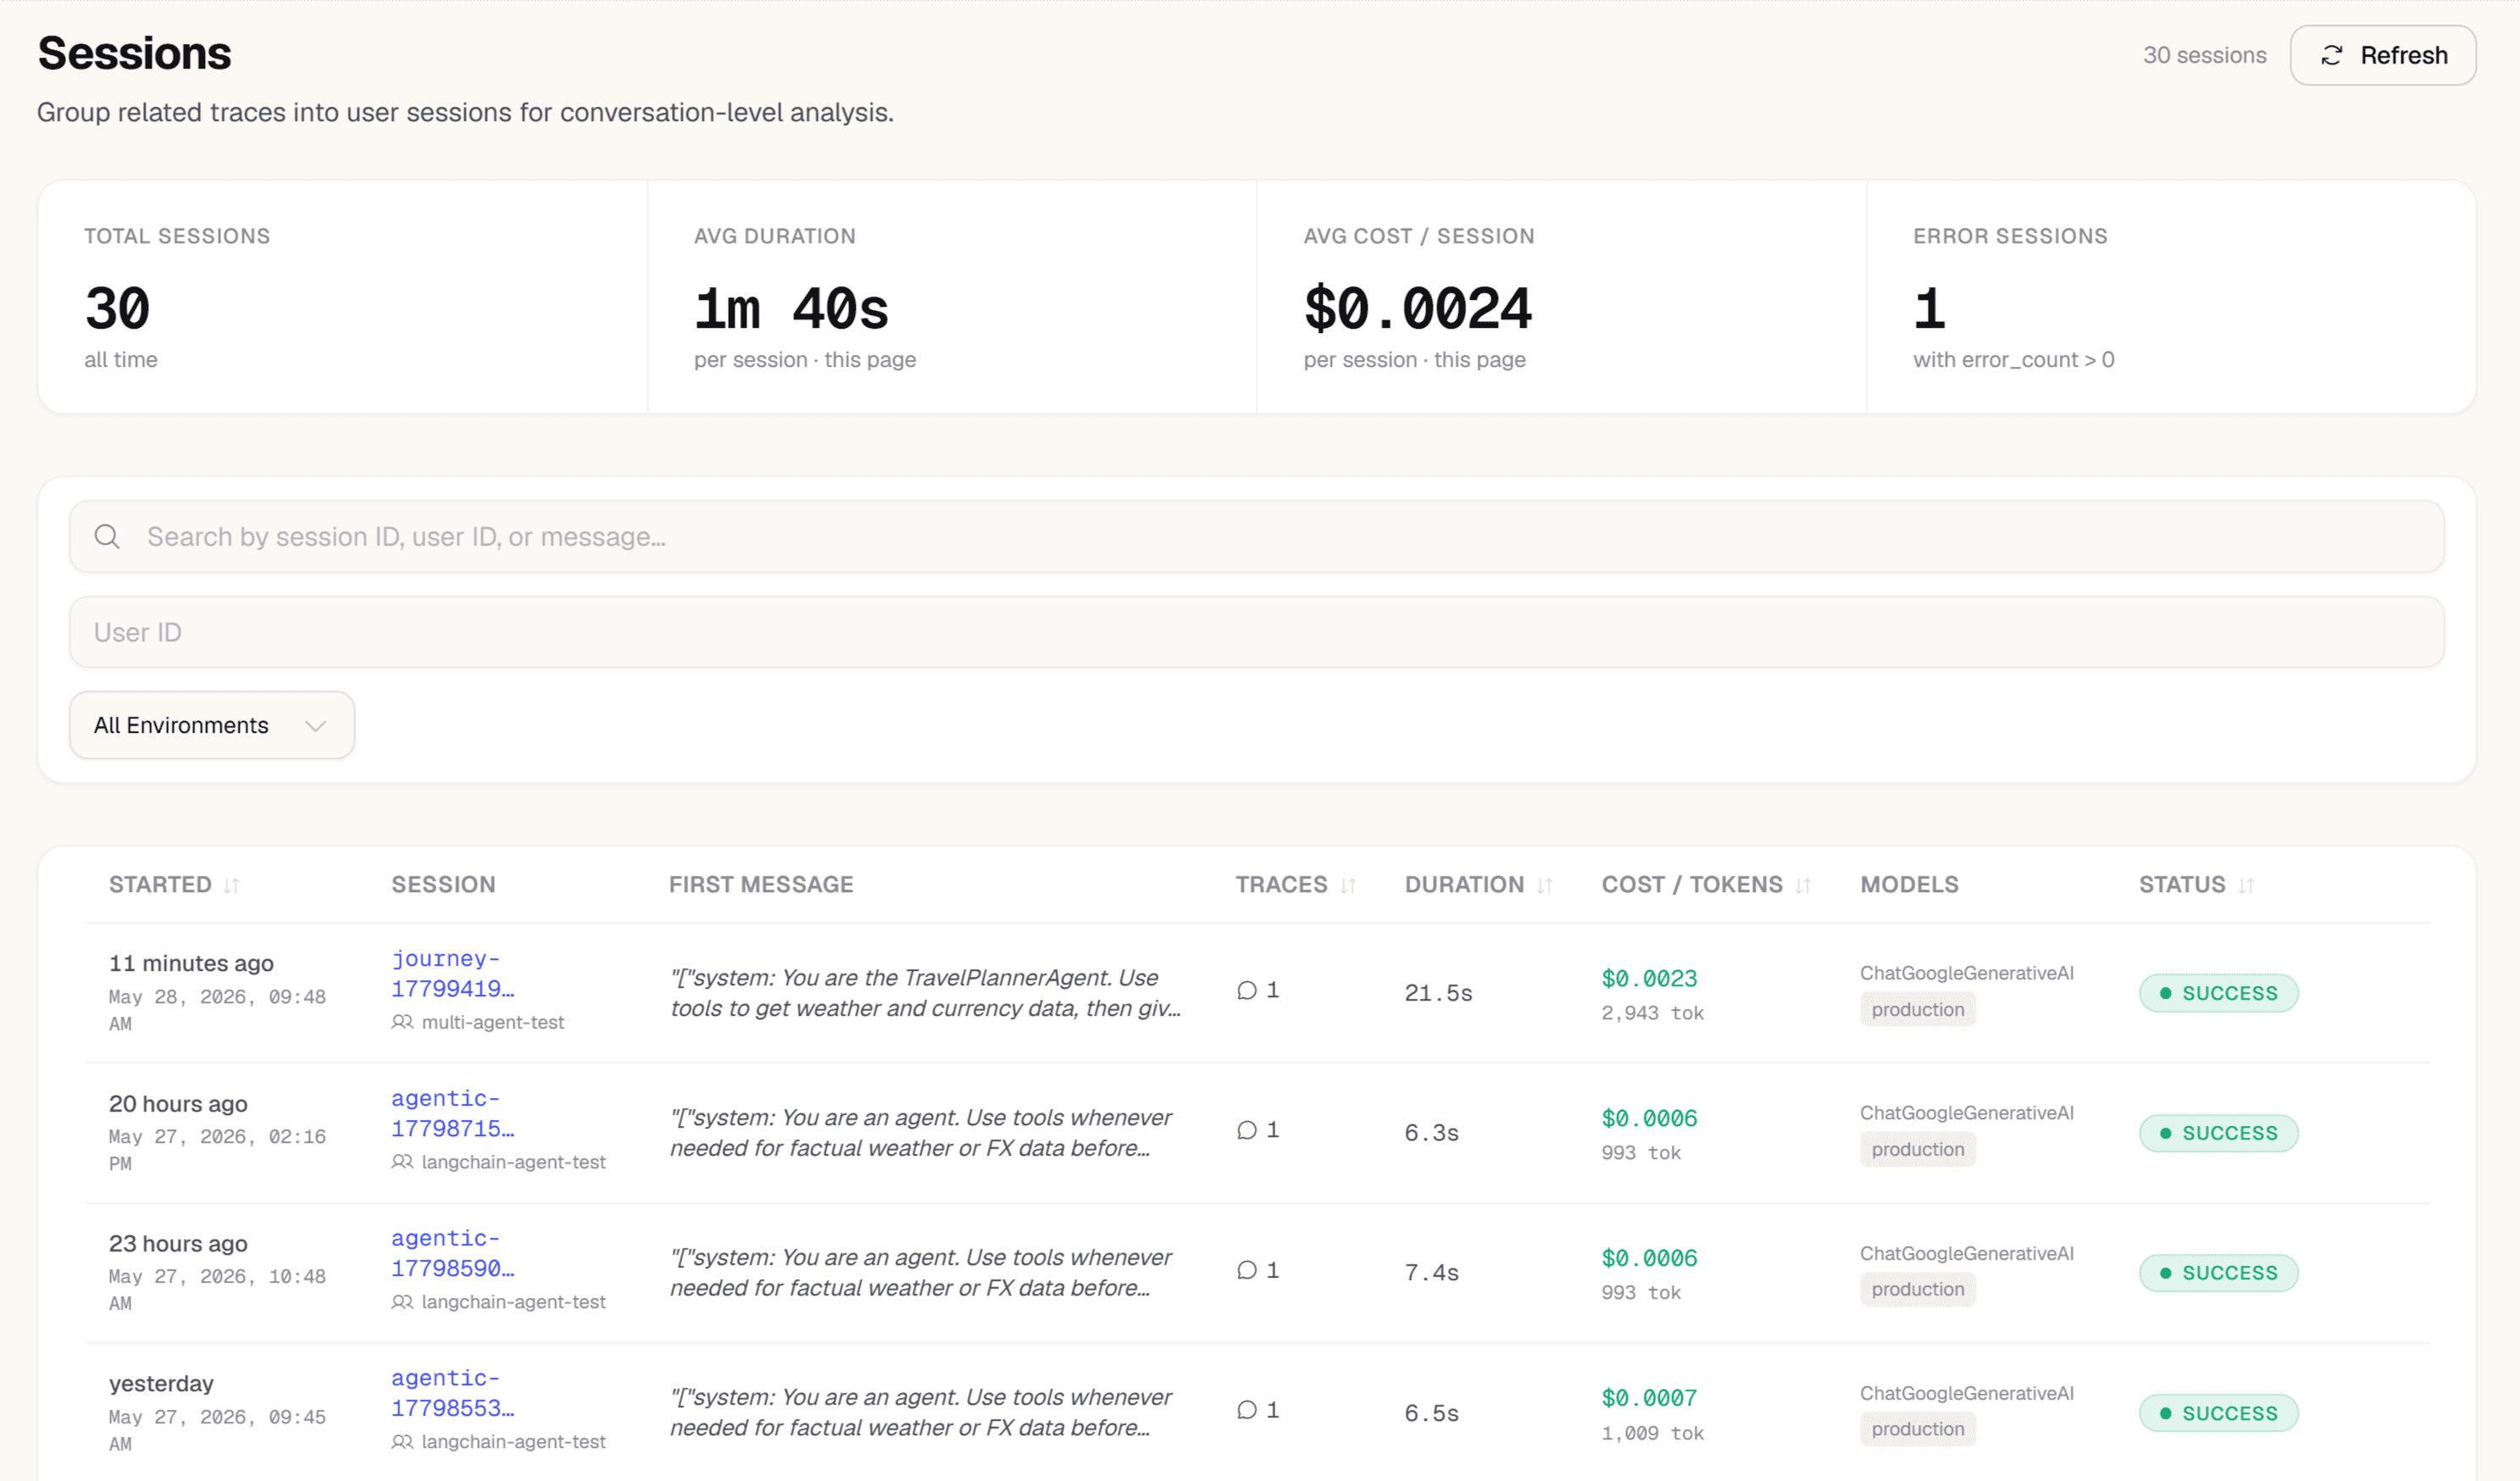
Session Grouping
Traces sharing a session_id are grouped into conversation sessions automatically. See total cost, token counts, error rate, and a first-message preview per conversation — no extra instrumentation.
- Session list: cost, tokens, error count, models used, first message preview
- Session detail: all traces chronological with per-trace breakdown
- user_id threading: per-user cost and usage across sessions
OpenTelemetry Ingest
Native OTLP/HTTP endpoint at /v1/otel accepts standard OTel spans, resource attributes, and instrumentation scopes. Plug in any OTel-compatible framework without changing how you instrument.
- Standard OTLP/HTTP — no proprietary format required
- Works with OTel Collector, LangChain, CrewAI OTel export, and custom exporters
- BaggageSpanProcessor propagates custom baggage through distributed spans
AI Root Cause Analysis
Click 'Analyze' on any failed trace and Zespan runs AI-powered root cause analysis over the full span tree — returning a structured explanation of what failed, which span is the root cause, and why.
- One-click from trace detail — no configuration required
- Works across multi-agent traces: attributes failures to the correct agent
- Returns structured explanation, not raw log output
Get started
Set up in under 5 minutes
import { Zespan, wrapOpenAI } from '@zespan/sdk';

const lt = new Zespan({ apiKey: process.env.ZESPAN_API_KEY });
const openai = wrapOpenAI(new OpenAI(), lt);

// All completions now traced — tokens, cost, latency, errors
const res = await openai.chat.completions.create({ model: 'gpt-4o', messages });Frequently asked
Does adding the SDK affect my app's latency?
No. Traces are sent asynchronously — events are queued in the background and written to ClickHouse by a worker process. The SDK adds zero latency to your LLM calls.
Do I need OpenTelemetry to use Zespan?
No. The SDK's wrapOpenAI(), wrapAnthropic(), and similar wrappers handle instrumentation automatically. OpenTelemetry is an alternative path if you're already using OTel or want to use the OTLP/HTTP endpoint directly.
What frameworks does tracing support?
OpenAI, Anthropic, Google GenAI, Bedrock, Groq, Mistral, OpenRouter (provider wrappers), plus LangChain, CrewAI, AutoGen, Google ADK, LlamaIndex, Vercel AI SDK, and PydanticAI (framework handlers). OpenTelemetry covers any other framework.
How long is trace data retained?
Retention depends on plan: 14 days (Free), 30 days (Solo), 90 days (Pro), 180 days (Team). Enterprise retention is configurable.
Is my LLM call data used to train models?
No. Your trace data is never used for model training by Zespan or shared with any third party.
Start free — 10K traces/month, no card needed
Setup takes under 5 minutes. Works with OpenAI, Anthropic, LangChain, and more.