Feature  ·  ZespanPilot

Ask your production data anything, in plain English.

Conversational AI copilot that queries your agent data in plain English, takes actions on your behalf, and knows what you're looking at right now.

Natural language query, action execution, approval workflow, and in-app notifications.

Start free →View docs
Zespan ZespanPilot
Works withPage contextAction executionApproval workflowCSV exportReportsNLQ

NLQ

natural language

CSV

export & reports

approval workflow

1.0  ZespanPilot

Natural Language Query

What you get

Plain English queries — no SQL or dashboard configuration requiredDrilldown: follow-up queries inherit filters, time range, and groupByQuery history: all queries saved per project, rerunnable

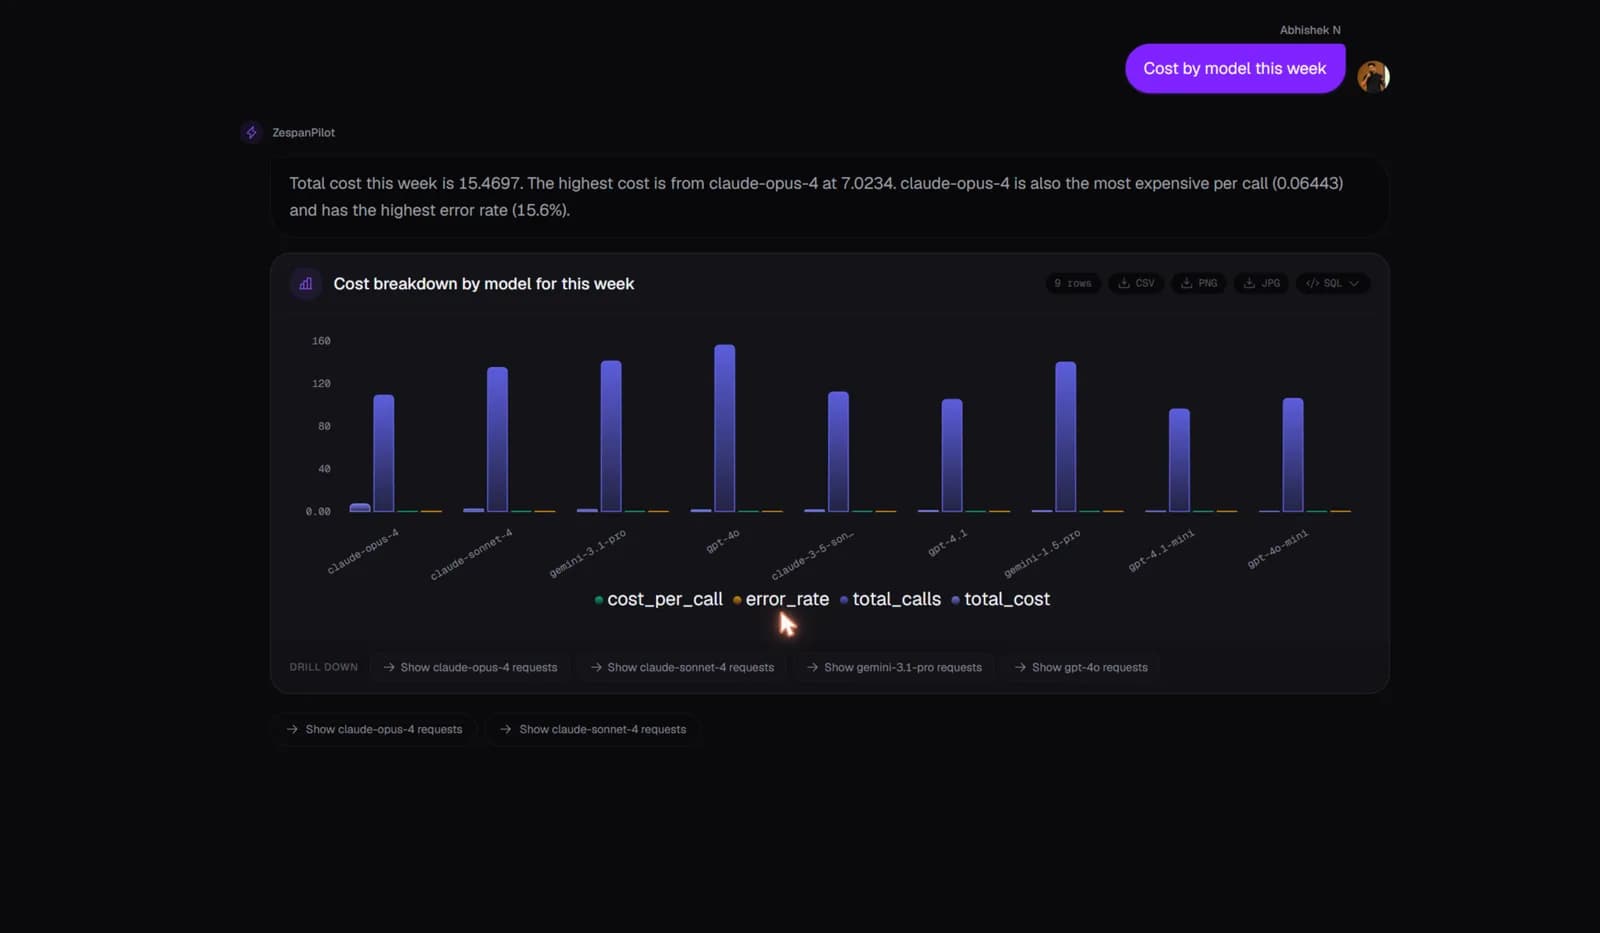
Ask questions in plain English — ZespanPilot queries your agent data and explains results instantly. Follow-up queries inherit context (filters, time range, groupBy) from previous turns. Query history is saved per project and rerunnable with one click.

ZespanPilot chat showing natural language question and result table

2.0  ZespanPilot

Page Context Awareness

What you get

Context: current page, active trace, selected filters, model, time rangeSmart suggestions: recommended queries based on your current viewAuto-completions: query suggestions as you type

ZespanPilot knows your current page, the active trace, your selected filters, the model you're looking at, and your time range. Every answer is relevant to what you're doing — no need to re-specify context.

3.0  ZespanPilot

Action Execution & Approval

What you get

Actions: create alerts, update prompts, modify guardrailsApproval workflow: high-risk actions require admin reviewApproval states: pending, approved, rejected, expired

ZespanPilot can take actions on your behalf: create alert rules, update prompt labels, modify guardrail config. High-risk actions are queued as pending for admin review before executing. Approvals auto-expire. Full audit trail.

4.0  ZespanPilot

Export, Reports & Notifications

What you get

CSV and JSON export for any query resultReports: bundle multiple query results into a shareable linkNotifications: quality_regression, anomaly, incident events with severity

Export any query result as CSV or JSON. Bundle multiple results into a shareable report. ZespanPilot generates in-app notifications for quality regressions, cost anomalies, and incidents — with severity levels from critical to info.

Setup

Under 5 minutes,
two lines of code.

No forking and no architecture changes. Traces appear within seconds of the first agent run, with cost attribution, eval scores, and anomaly alerts on by default.

typescript
// ZespanPilot is in-product — no SDK setup required.
// Access it from the sidebar on any dashboard page.

// Example queries you can ask:
// "Which agent had the highest error rate yesterday?"
// "Show me the 10 most expensive traces in the last 7 days"
// "What changed in agent performance after Tuesday's deploy?"
// "Create an alert if error_rate > 5% over 15 minutes"

Common questions

Can ZespanPilot actually change things in my project?

Yes — that's the point of action execution. ZespanPilot can create alert rules, update prompt labels, and modify guardrail config. High-risk actions go through an approval workflow: they're queued as pending, an admin reviews and approves or rejects, and only then are they executed. Low-risk reads never require approval.

Is ZespanPilot aware of my current page?

Yes. ZespanPilot reads your current page, the active trace or session you're viewing, your selected time range, and your applied filters. If you ask 'what's the error rate for this trace?' it knows which trace you mean without you specifying.

Does ZespanPilot have access to the actual content of my LLM calls?

ZespanPilot has access to your trace data — the same data you can see in the Trace Explorer, including inputs and outputs. Access is scoped by your project's RBAC roles: viewers can query read-only; only admins can trigger write actions.

What is ZespanPilot built on?

ZespanPilot is built on Zespan's own agent infrastructure — low-latency, context-aware, and fully integrated with your project's data and permissions.

Explore more features

All features →
TracingSee exactly what your agents are doing.Every LLM call, agent step, and tool invocation captured as a structured trace — with cost, latency, and tokens per span.Agent MonitoringKnow which agents are healthy, and which aren't.Composite health scores, delegation graphs, and per-agent cost attribution — built for systems with many cooperating AI agents.EvaluationsMeasure output quality on every trace, automatically.12 built-in LLM-as-judge templates run on every new trace with no setup. Track quality trends, catch regressions, and run manual eval campaigns.GuardrailsStop bad outputs before they reach users.7 guardrail types run inline on every LLM request — block, warn, redact, or log. PII, toxicity, topic drift, format, cost ceiling, and custom rules.

Your agents are running.
Do you know what they’re doing?

Observe, evaluate, guard, and control every agent, live in minutes. No credit card required.

Free tier availableUnder 5 min setupNo credit card