Use Case — Multi-Agent
See every handoff, tool call, and planning step across your agent system.
When an orchestrator delegates to sub-agents, when a ReAct loop stalls, when a tool call errors silently — you need to know exactly where. Here's how Zespan shows you.
The problem
Attribution is impossible
One user request spawns an orchestrator, three sub-agents, and twelve tool calls. When something fails, you can't tell which agent in the chain caused it.
Cost is invisible per agent
You see total LLM spend but can't attribute it to specific agents or roles. One expensive agent can silently drive up costs with no signal.
Quality degrades without warning
A sub-agent starts returning lower-quality outputs. No eval coverage means you find out from a user complaint days later.
How to use Zespan for this
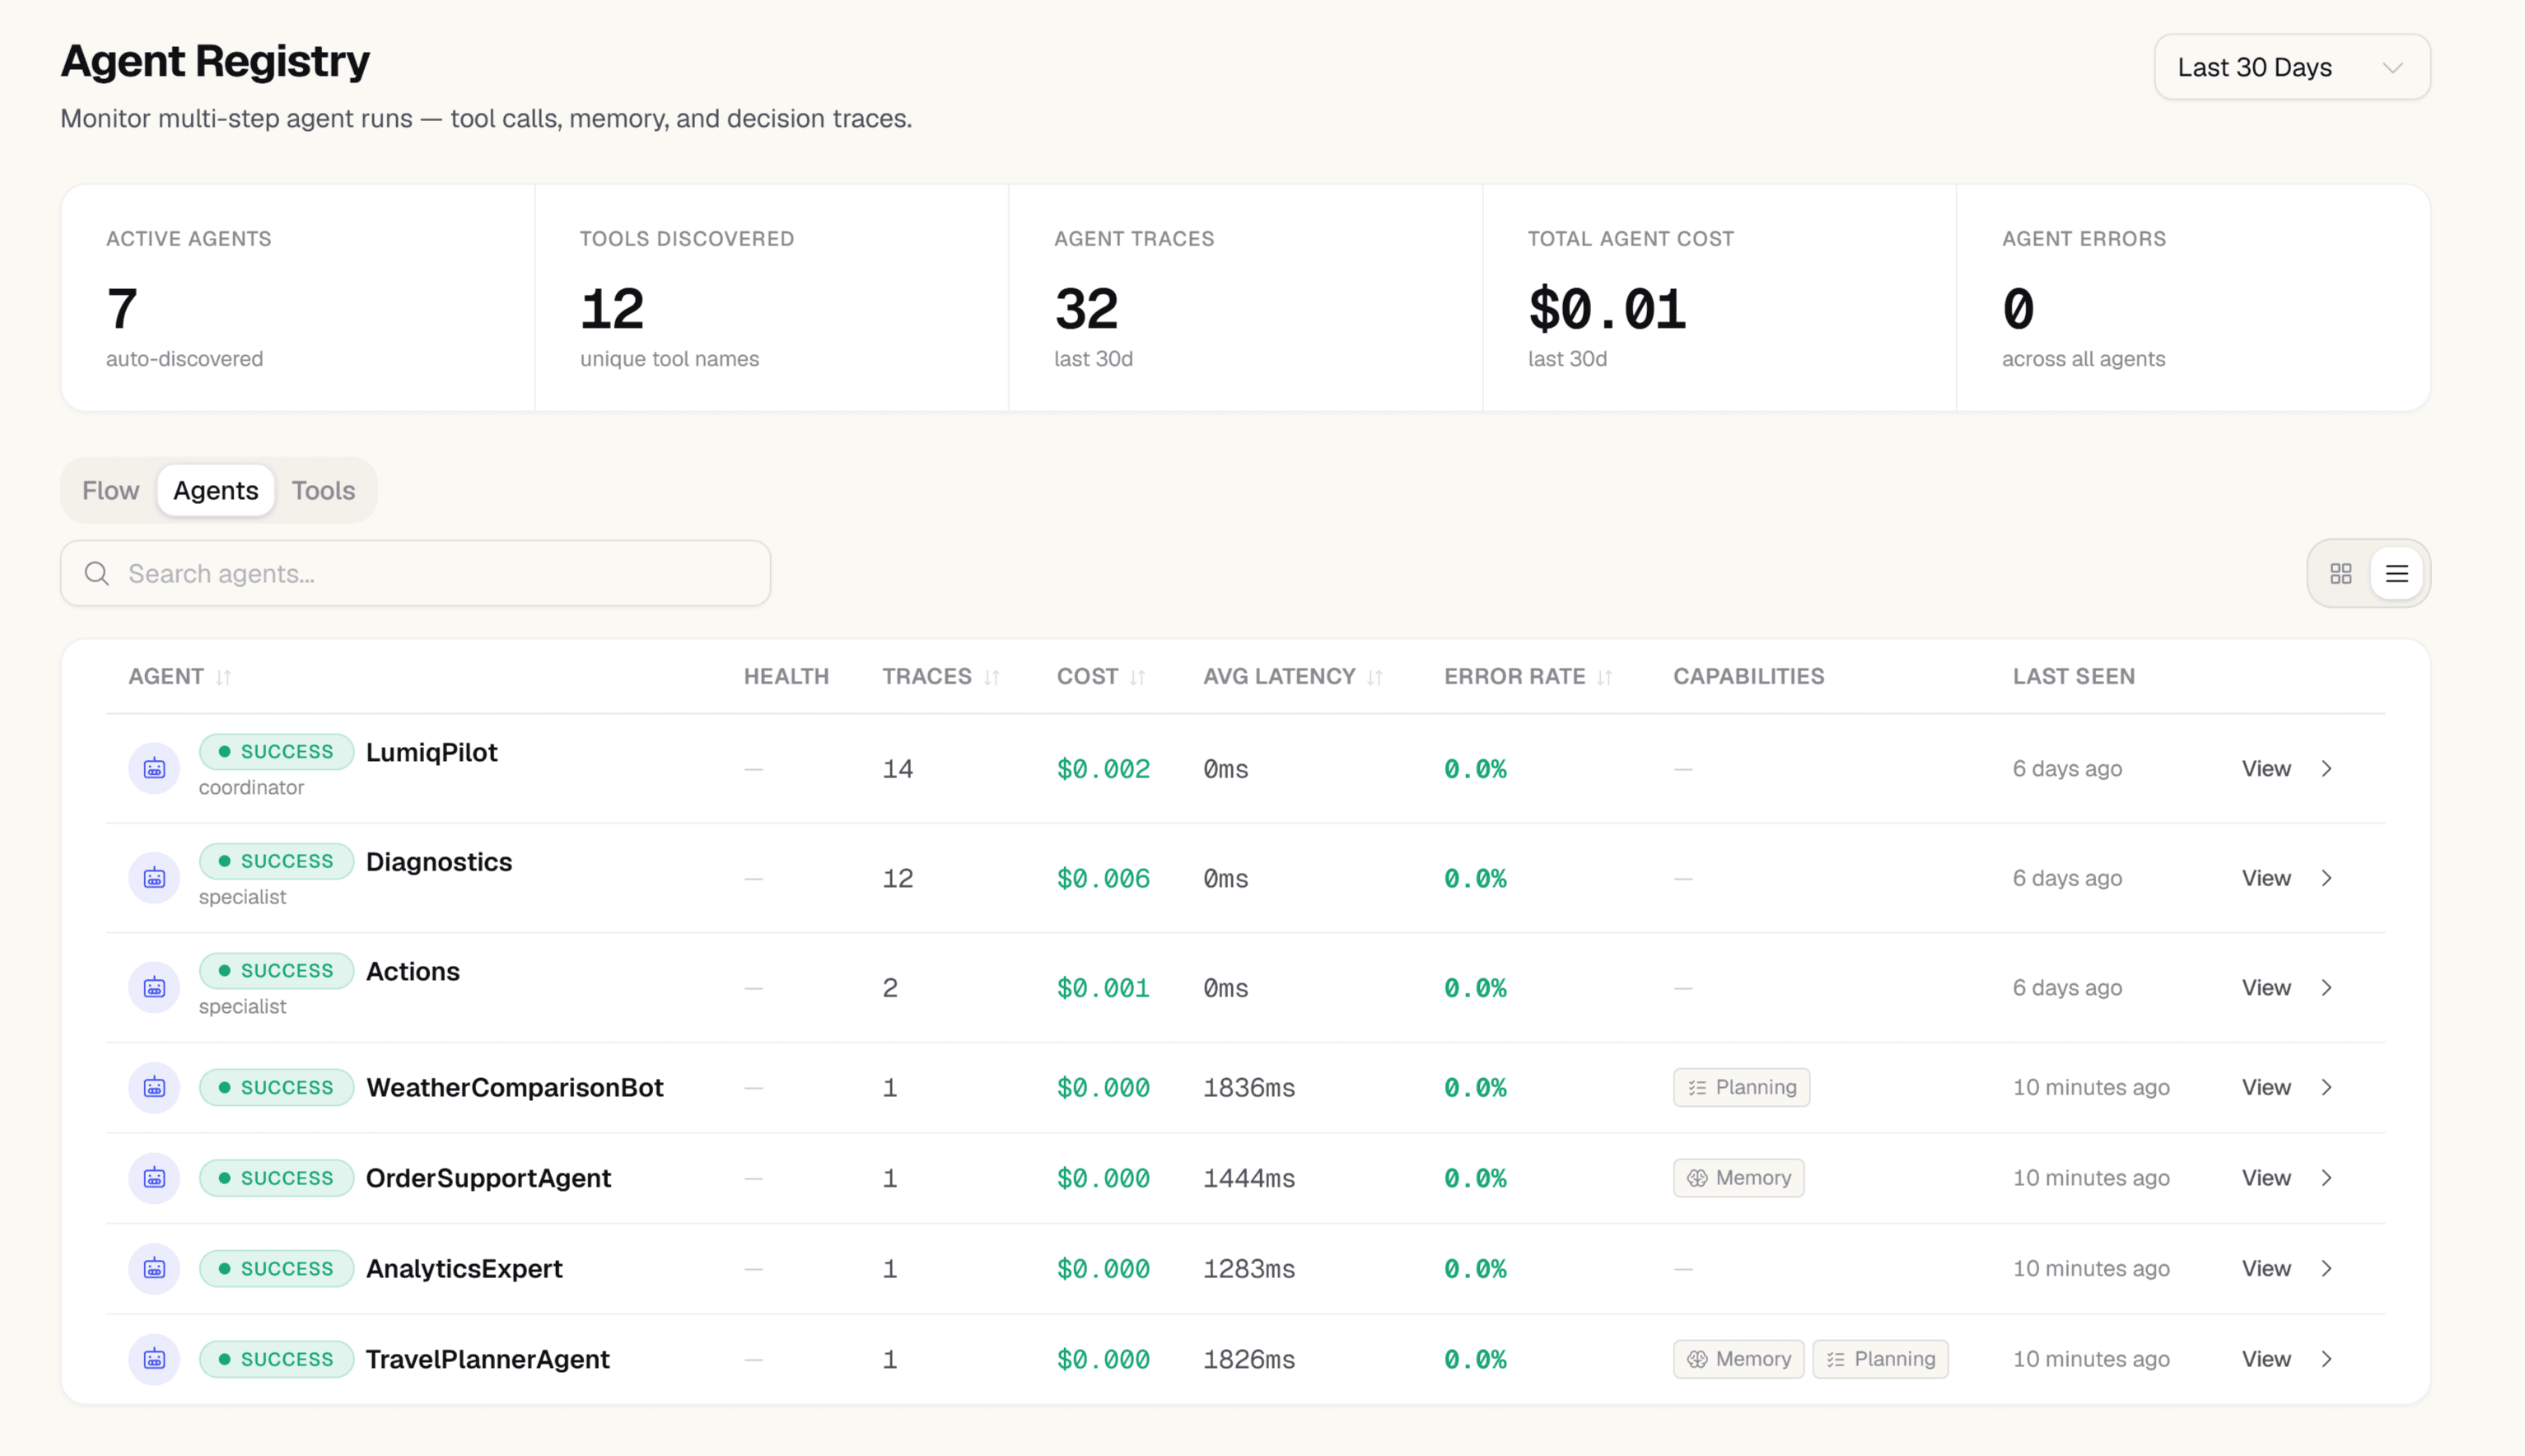
Open the Agent Registry — every agent appears automatically
On the first run after adding the SDK, open Agent Registry in the sidebar. Every agent that made an LLM call is listed — name, role, and framework detected from span attributes. No registration step. No config file. Just your agents, discovered.
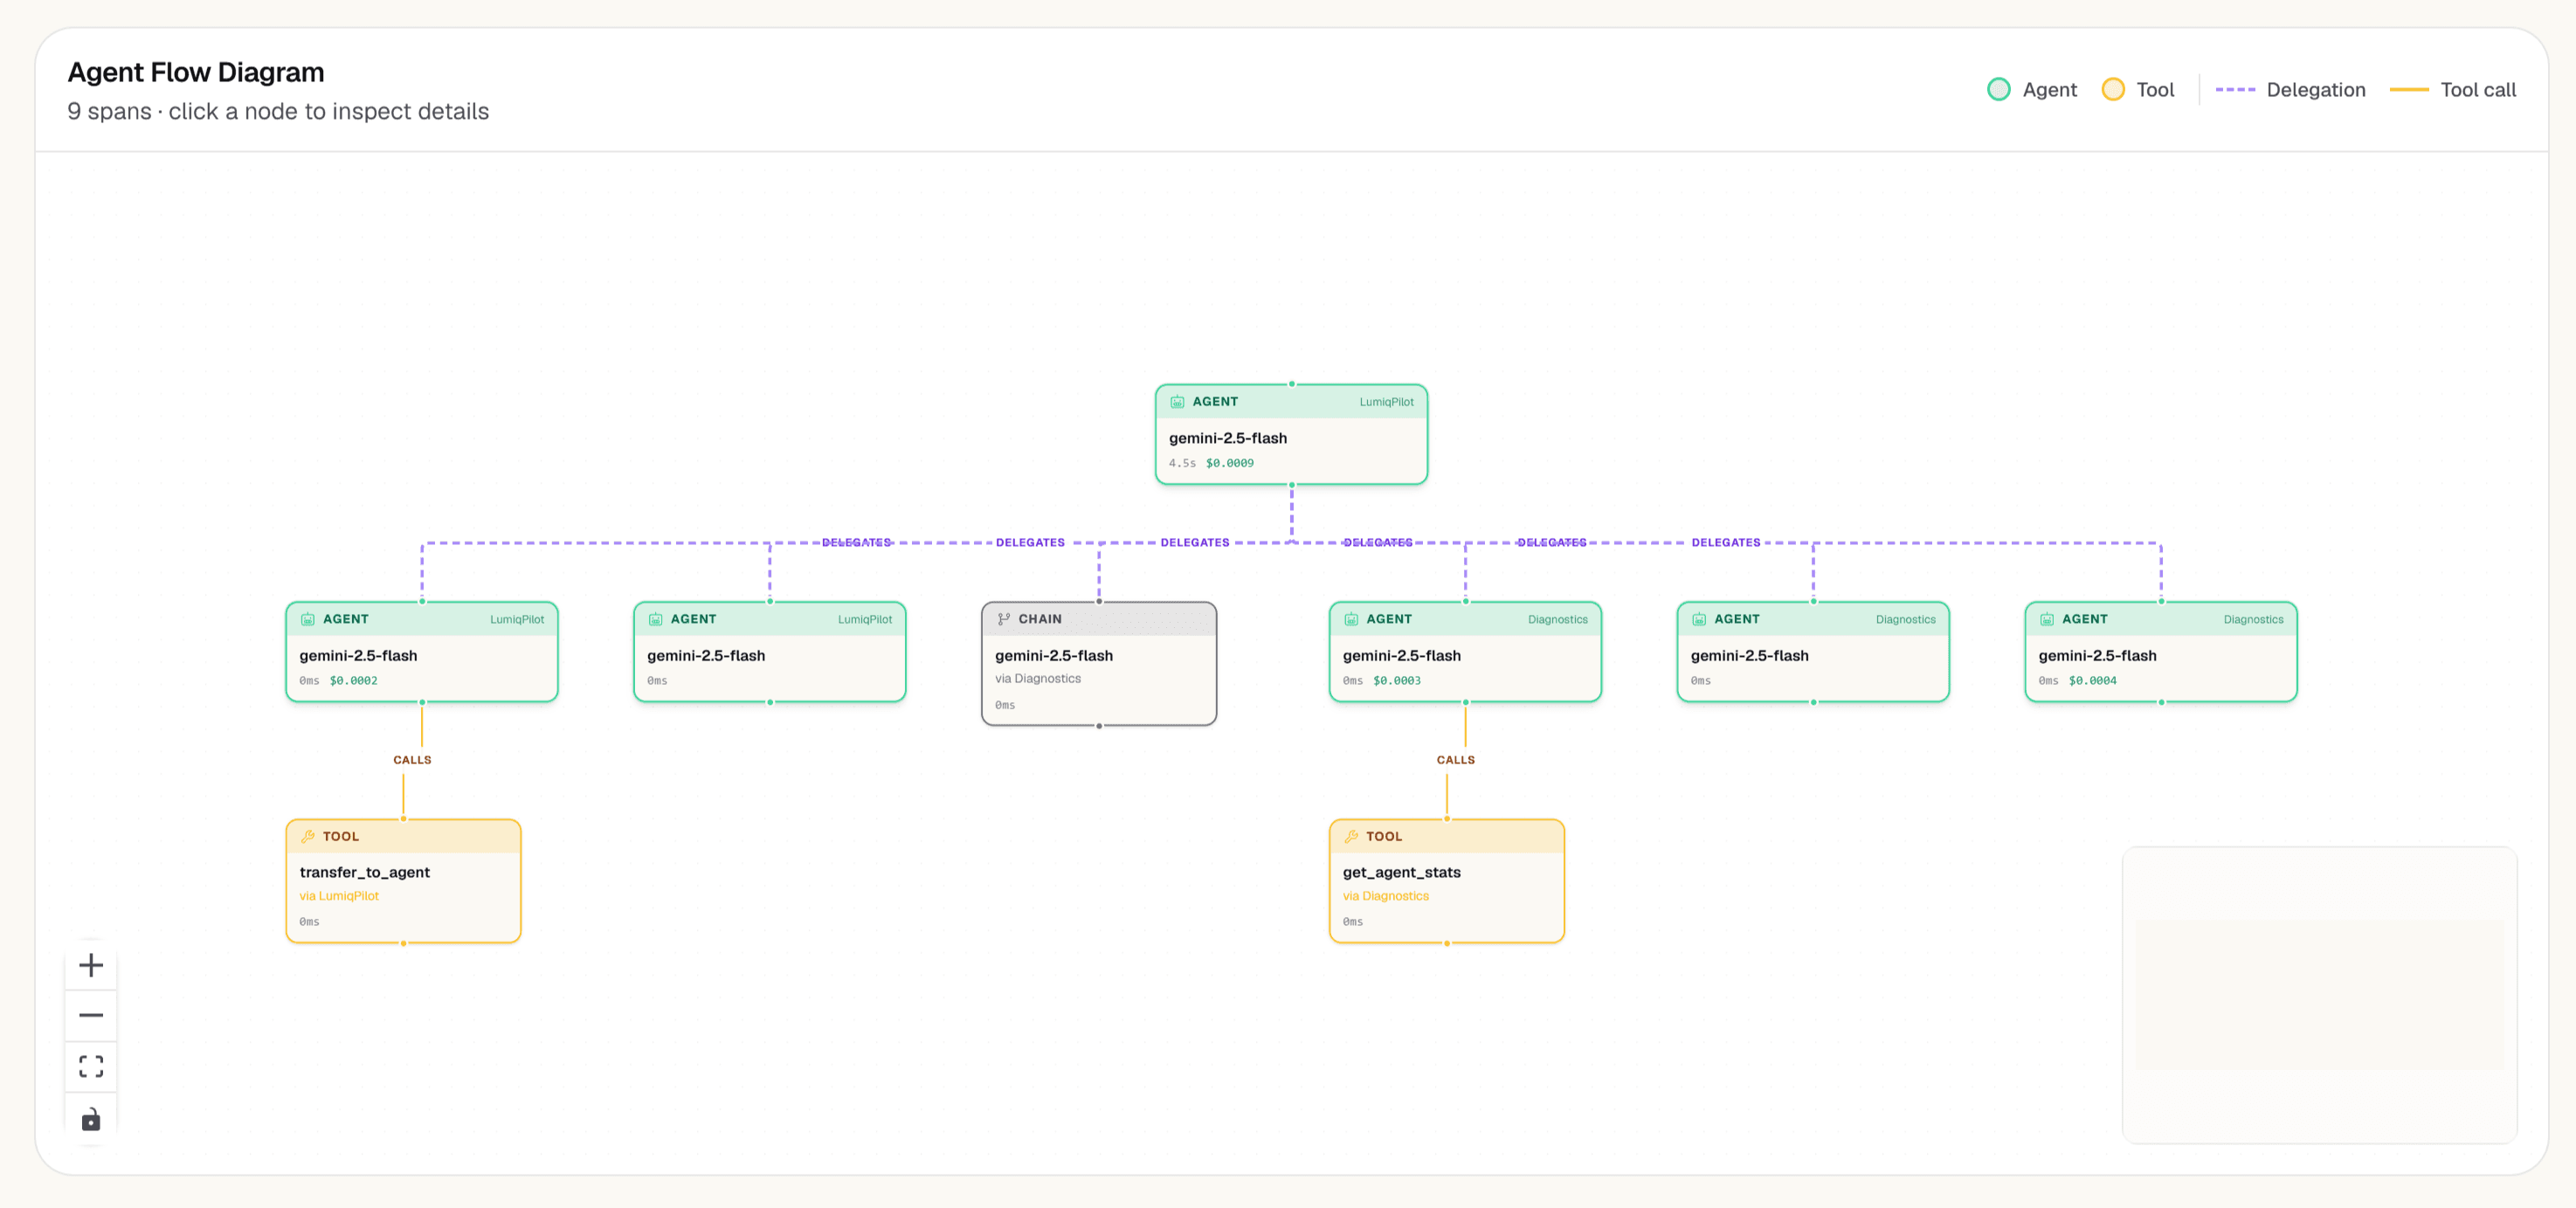
Open the Delegation Graph — see who calls whom
Click 'Delegation Graph' on any agent or trace. The graph draws every handoff edge in your system: which orchestrator delegates to which sub-agent, with cost and latency per hop. A long edge with high latency tells you exactly where your pipeline is slow.
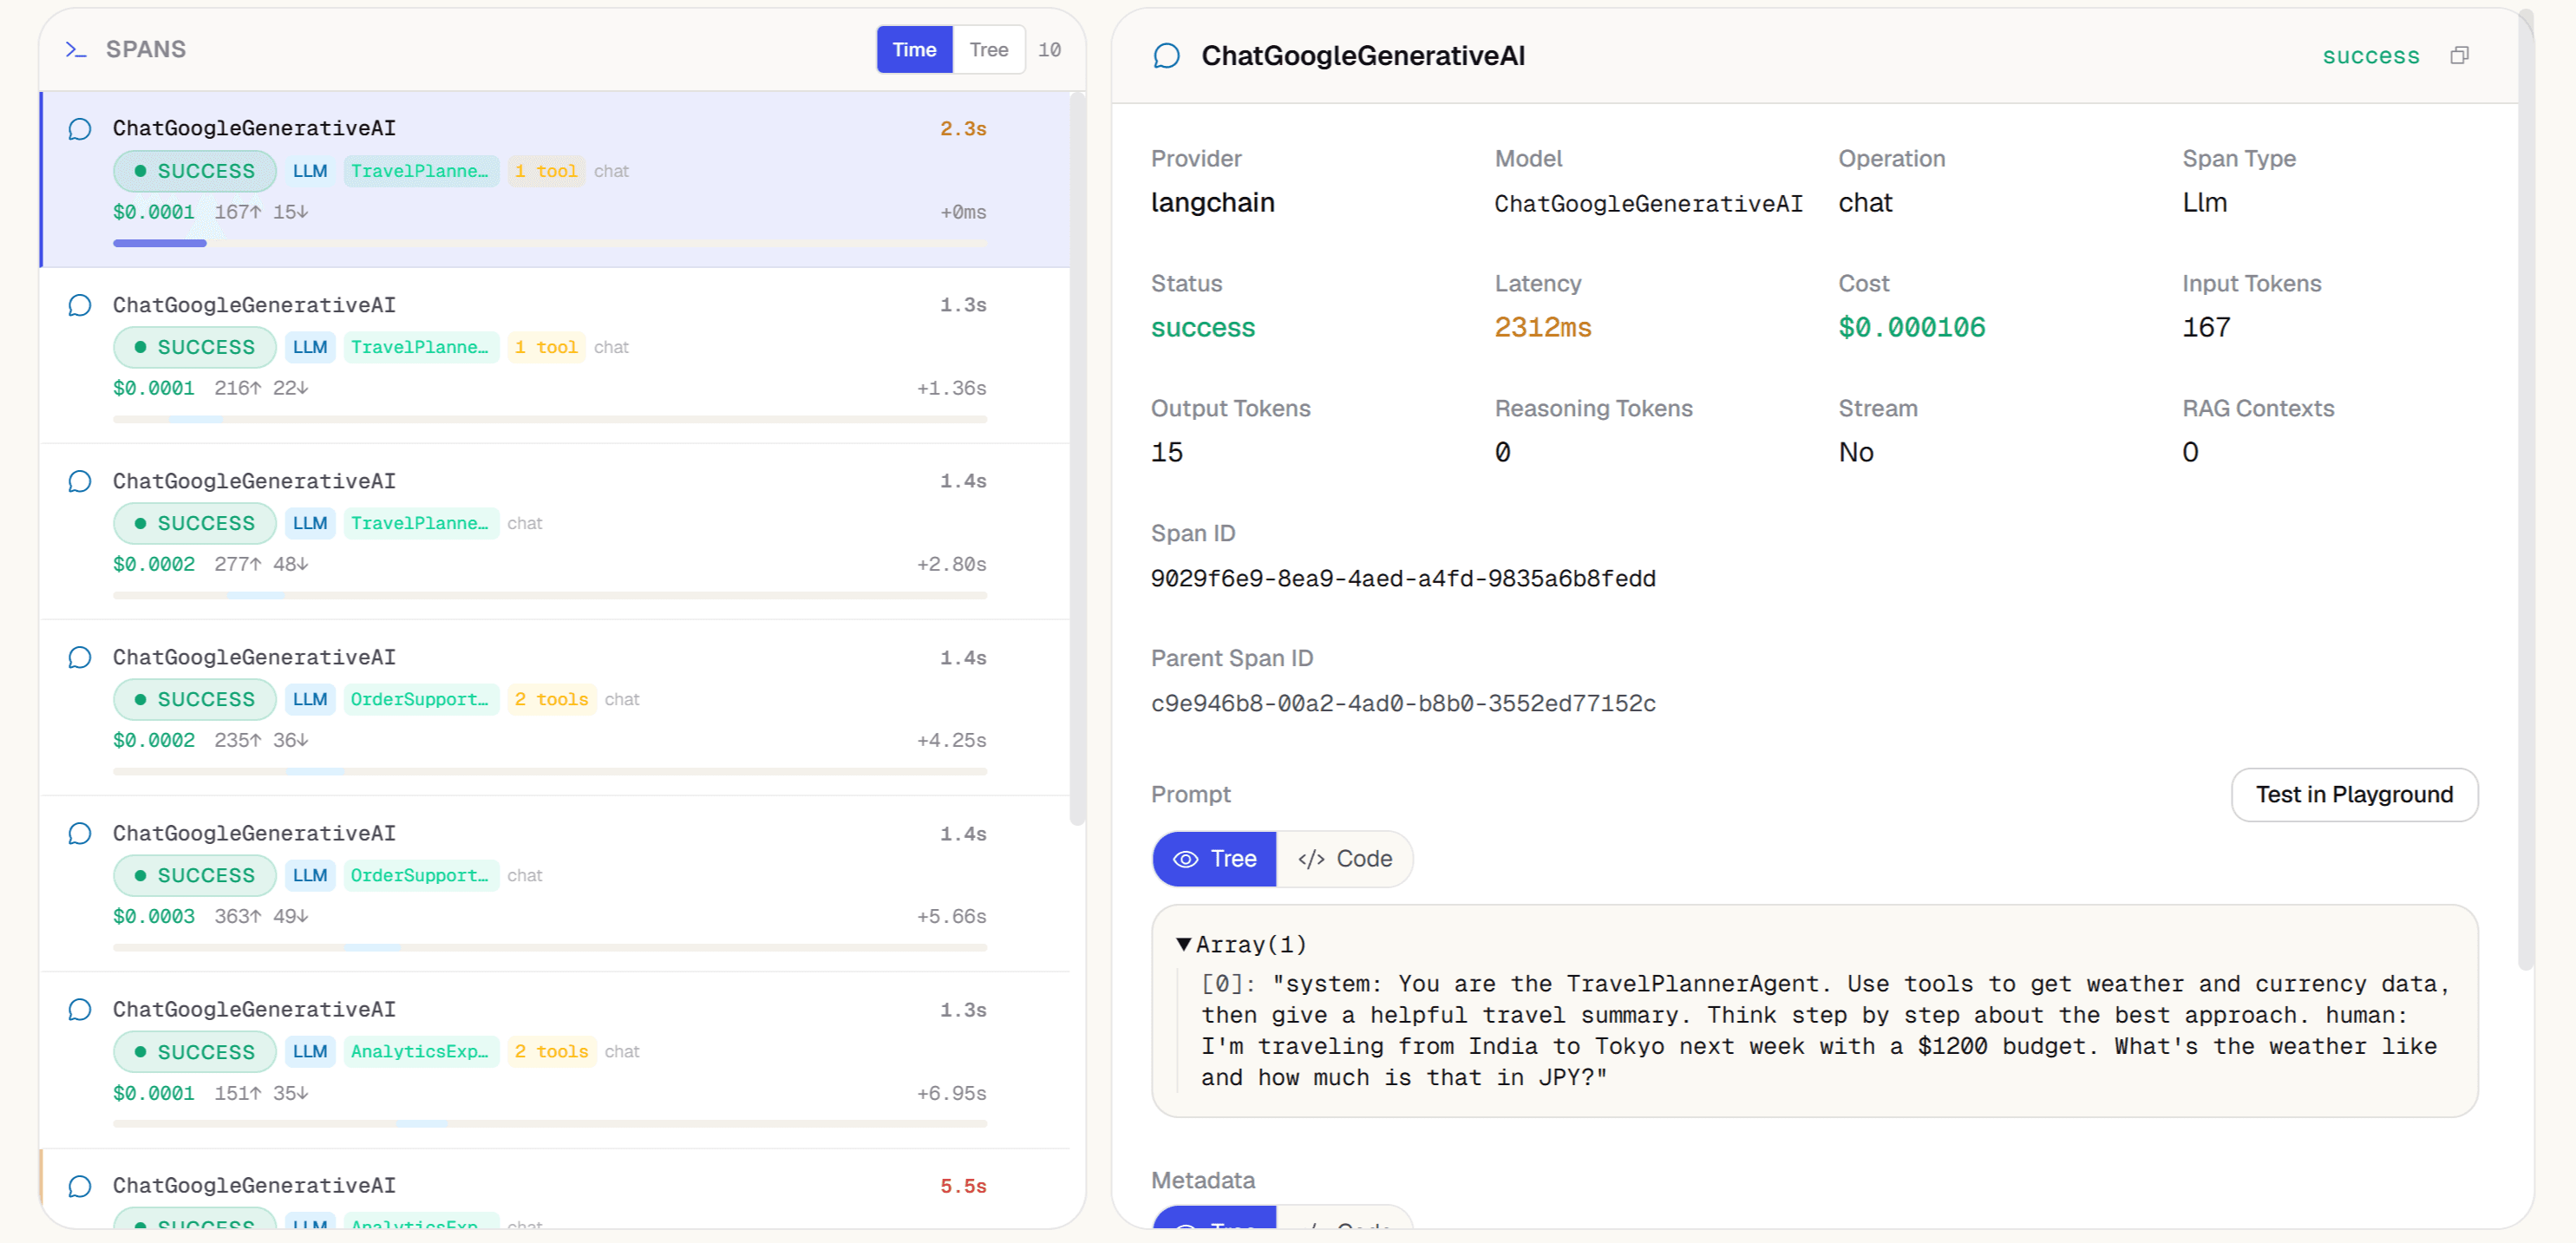
Click any trace — span waterfall shows the full chain
In Trace Explorer, click any failing or slow trace. The span waterfall shows every planning step, LLM call, and tool invocation as a nested span with exact timing, tokens, and cost. Filter by agent_name to isolate one agent's contribution across thousands of traces.
Check Agent Health — A–F scores flag degrading agents early
Open the Agent Health dashboard. Every agent has a composite score (0–100, A–F) weighted by error rate, cost trend, and eval pass rate. When a sub-agent's score drops from A to C over a week, you see it here — before it propagates to end users.
Set an alert — get paged before users notice
In Alerts, create a rule: error_rate > 5% on your orchestrator agent's spans, 15-minute window, fire to Slack or PagerDuty. Now degradation triggers a page, not a user complaint. Pair with an eval-based alert for quality regressions.
Start free — 10K traces/month, no card needed
See every agent decision, tool call, and handoff in production. Setup takes under 5 minutes.
Get started free →